
Research Article - (2022) Volume 9, Issue 3
Received: 17-Aug-2022, Manuscript No. IJUN-22-72059; Editor assigned: 19-Aug-2022, Pre QC No. IJUN-22-72059 (PQ); Reviewed: 02-Sep-2022, QC No. IJUN-22-72059; Revised: 09-Nov-2022, Manuscript No. IJUN-22-72059 (R); Published: 17-Nov-2022
Purpose: To evaluate the potential of 3T magnetic resonance Diffusion Kurtosis Imaging (DKI) in assessing the renal damage in early stage of Chronic Kidney Disease (CKD) patients with normal or slightly changed functional index, using histopathology as reference standard.
Methods: 49 CKD patients and 18 healthy volunteers were recruited in this study. CKD patients were divided into two groups based on estimated Glomerular Filtration Rate (eGFR): Study group I ((CKD stage 1) eGFR ≥ 90 ml/min/1.73 m2 (n=20)) and Study group II (eGFR<90 ml/min/1.73 m2 (n=29)). DKI was performed in all participants and the DKI parameters Mean Kurtosis (MK), Mean Diffusivity (MD), Fractional Anisotropy (FA) of renal cortex and medulla were measured. The differences of parenchymal MD, MK and FA values among the different groups were compared. The correlations between DKI parameters and clinicopathological characteristics were assessed. Diagnostic performance of DKI to assess renal damage in early stage of CKD was analyzed.
Results: The cortical MD and MK values showed significant difference among three groups (P<0.05): Trend of cortical MD values: Study group II
Conclusion: DKI shows potential in non-invasive and multi parameter quantitative assessment of renal damage in early stage of CKD patients and provide additional information for changes in renal function and histopathology when CKD progressed.
Diffusion kurtosis imaging, Mean kurtosis, Mean diffusivity, Fractional anisotropy, Chronic kidney disease, Renal damage
Chronic Kidney Disease (CKD) is defined as the continuous reduction in renal function for more than three months and can lead to renal failure, which is recognized as the major public health problem in the world [1]. Effectively delayed progression of CKD is feasible if it can be accurately evaluated and contrapuntally treated in its early stage. The clinical index and histopathology have been used as the common methods to assess the renal damage. However, the improper collection of urine samples makes the results inaccurate. The functional indexes such as serum creatinine (Scr) and eGFR are not sensitive to the renal damage in early stage of CKD patients, since the period is still in the compensatory stage. The histopathology is the gold standard for assessing the severity of renal damage, which must be obtained through invasive approach [2-5]. Therefore, there is an urgent clinical need for a non-invasive and sensitive technique that can be used to evaluate renal damage in early stage of CKD and monitor its progress over time.
CKD is associated with structural changes in its early stage [6]. In recent years, functional magnetic resonance imaging has been applied to evaluate the changes in microstructure of renal tissue. Based on the extension of Diffusion Weighted Imaging (DWI) and Diffusion Tensor Imaging (DTI) technology, Jensen developed DKI to evaluate the deviation of water diffusion from Gaussian distribution, which provides quantitative parameters such as Mean Kurtosis (MK), Mean Diffusivity (MD) to better reflect the restriction of the water molecules diffusion in the tissue [7-9]. DKI quantify the integrity and density of the microstructure, which can be considered as a biomarker of the heterogeneity of tissue microstructure, showing great clinical value.
Recently, DKI has been successfully applied in the normal human kidney tissue and has been used to assess renal fibrosis in animal models [10,11]. A new study showed that DKI can assess renal function in patients with Immunoglobulin a nephropathy [12]. However, currently no research is found to explore the value of DKI in assessing the renal damage in the early stage of CKD, which is critical to the clinical treatment. The purpose of this study is to evaluate the feasibility of DKI parameters to identify changes in renal diffusion of early stage CKD patients, with histopathology as a reference standard.
Participants
This study was evaluated and approved by the committee for medical ethics and was performed in accordance with the principles of the declaration of Helsinki. Written informed consent was obtained from all of the participants.
Between June 2021 and March 2022. 62 consecutive patients with renal disease in our hospital who needed kidney biopsy to confirm the diagnosis were enlisted and referred to MR imaging before kidney biopsy. Inclusion criteria were as follows: 1) Age over 18 y; 2) CKD patients based on clinical diagnosis; 3) Patients with renal disease undergoing renal puncture for the first time; 4) Willing to provide informed consent. Exclusion criteria were as follows: 1) With renal neoplastic lesions (diameter>10 mm); 2) Polycystic kidney disease; 3) The image quality does not meet the measurement requirements; 4) Patients with contraindications for MRI such as ferromagnetic implants or claustrophobia.
Eventually, 49 CKD patients (25 men and 24 women, age ranging from 28 to 65 years) were included in this study. A group of 18 sex and age matched individuals (8 men and 10 women; age ranging from 23-67 years) from our Hospital were enrolled as volunteers. All volunteers had no kidney diseases. Their clinical indexes such as 24 h Upro, Scr and eGFR levels were normal and their kidneys were morphologically normal. Flowchart of the study population is shown in Figure 1.

Figure 1. Flowchart of the study population.
Clinical indexes detection
Within one week before MRI scan, the clinical indexes such as Scr, Homocysteine, Uric acid, Hb, CCR were detected. The eGFR was computed on the basis of Chronic Kidney Disease Epidemiology Collaboration (CKD-EPI) formula [13]. eGFR (ml/min/1.73 m2)=141 × min (Scr/b,1)c × max (Scr/b,1)-1.29 × (0.993)Age × 1.018 (if female) × 1.159 (if black). (B is 0.7 for female and 0.9 for male, c is -0.329 for female and-0.411 for male).
49 CKD patients were divided into two groups based on eGFR: Study group I ((CKD stage 1) eGFR ≥ 90 ml/min/1.73 m2 (n=20)) and study group II (eGFR<90 ml/min/1.73 m2 (n=29)). Study group I were consisted of 20 patients, 6 males and 14 females, age ranging from 30-62 years; study group II were consisted of 29 patients, 19 males and 10 females, age ranging from 28-65 years.
Renal histopathological evaluation
Renal biopsy was performed within 2 days after the patients completed the MRI examination, and selected the right kidney lower pole as the biopsy point [14]. All of the specimens were sent for electron microscope, optical microscopy and immunofluorescence evaluation by two professional pathologists in the laboratory of our hospital, who were blinded to the information of patients. The severity of pathology were evaluated based on the score of chronic lesions in individual renal tissue compartments. The score includes global and Segmental Glomerulosclerosis (GS), Tubular Atrophy (TA), Interstitial Fibrosis (IF) and arteriosclerosis. Scoring and subsequent grading of the chronic changes are proposed as follows: global and segmental GS is scored from 0 to 3, TA from 0 to 3, IF from 0 to 3, and arteriosclerosis from 0 to 1 (Table 1) [15]. For more detailed analysis of tubulointerstitial lesions, the severity of tubulointerstitial injury were evaluated based on the standard of Katafuchi, et al. [16] (Table 2).
| Tissue compartment* | Score | |||
|---|---|---|---|---|
| 0 | 1 | 2 | 3 | |
| Glomerulosclerosis (GS score) score) | <10% | 10-25% | 26%-50% | >50% |
| Interstitial Fibrosis (IF score) | <10% | 10-25% | 26%-50% | >50% |
| Tubular atrophy (TA score) | <10% | 10-25% | 26%-50% | >50% |
| Arteriosclerosis (CV score) | Intimal thickening<thickness of media | Intimal thickening ≥ thickness of media | ||
| *GS score includes the percentage of glomeruli with global and segmental sclerosis and ischemic glomeruli; IF and TA score includes the percentage of renal cortex involved by interstitial fibrosis and tubular atrophy, respectively; CV score includes the severity of arteriosclerosis determined by the extent of thickening of the intima. | ||||
Table 1: Scoring of the chronic lesions in individual renal tissue compartments.
| Scores | Tubulointerstitial lesion score | ||
|---|---|---|---|
| Interstitialfibrosis (%) | Tubularatrophy (%) | Interstitial inflammatory cell inflitration (%) | |
| 1 | ≤ 25 | ≤ 25 | ≤ 25 |
| 2 | 25–50 | 25–50 | 25–50 |
| 3 | ≥ 50 | ≥ 50 | ≥ 50 |
| 4 | NA | NA | NA |
Table 2: A semi quantitative standard for calculating the scores of tubulointerstitial lesions.
MR imaging
Renal MRI acquisition
All subjects were examined with a 3.0 T clinical MRI scanner (GE Discovery 750) equipped with an eight channel body array coil. The scanning field covered bilateral kidneys, adrenal glands and part of liver. The subjects were scanned in supine position with advanced head, and the cross sectional images of kidney were collected by respiratory gated single spin echo imaging. Conventional MRI (cross sectional T2WI sequence) scanning was performed first. The parameters of cross sectional T2WI were TR=700.0 ms, TE=96.0 ms, Field of View (FOV) 28.5 cm × 38 cm, matrix 168 × 320, slice thickness 5.0 mm, layer spacing 1.0 mm. The kidney was scanned with DKI sequence, with a slice thickness of 4.0 mm and a slice spacing of 1.0 mm. The number of slices was 24-26, including the whole kidney. DKI sequence parameters: TR=4800.0 ms, TE=73.9 ms, Field of View (FOV) 40 cm × 40 cm, matrix: 192 × 192. NEX: 2.0, 30 diffusion directions, and b values that ranged from 0 to 2000 s/mm2 (0, 1000, 2000 s/mm2, respectively). The total scanning time was 10 minutes 23 seconds. All the patients were instructed to breathe freely during scanning.
Imaging post processing
DKI data were transferred to AW 4.6 workstation of GE company. All DKI data (b=0, 1000 and 2000 s/mm2) were used for DKI fitting and calculating parameters (FA, MD, MK), the DKI metrics were calculated by the following formula.
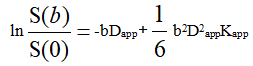
Here S(0) is the signal intensity without diffusion weighting and S(b) is the diffusion weighted signal intensity at a particular b value. Dapp is the apparent diffusion coefficient and Kapp is the apparent diffusion kurtosis.
Two experienced radiologists separately analyzed the images. Neither of them knew the patients’ clinical and histopathology information. The level near the renal hilum was selected as the measurement level. On the b=0 s/mm2 image, the Regions of Interest (ROIs) with 15-22 mm2 were positioned at each kidney. 3 ROIs were placed in cortex and medulla respectively of each kidney away from the structure of renal pelvis and the area where artifacts may appear. Bilateral kidneys were measured, 12 ROIs automatically copied to pseudo color maps of MK, MD and FA. In order to reduce errors, an average value was taken for every 3 ROIs in the renal cortex and medulla on each for every 3 ROIs in the renal cortex and medulla on each side. Example of ROI measurement on the b=0 s/mm2 image is shown in Figure 2.

Figure 2. Example of ROI measurement on the cross-sectional b=0 s/mm2 image.
The ROIs with 15-22 mm2 were positioned at each kidney, 3 ROIs were placed in the cortex and 3 ROIs were placed in the medulla of each kidney.
Statistical analysis
Data was collected and edited on the personal computer. All statistical analyses were realized through the IBM SPSS statistics 25.0. The research includes qualitative and quantitative data. Qualitative data were described using number and percent (n,%). The normality of data was tested with Shapiro wilk test. The DKI parameter values between the left and right kidneys, as well as between the renal cortex and medulla of all participants were compared by the paired sample t-test or rank sum test. The independent sample t-test was used for comparing the difference of MD, MK, FA values between the CKD patients and healthy volunteers. The renal parenchymal MD, MK and FA values among the three groups were compared by ANOVA and examined by LSD test for post hoc comparisons. The DKI parameter values of different pathological types of CKD were also compared.
The correlation between the DKI parameters and the clinicopathological characteristics were computed by Spearman correlation analysis. Moreover, the linear regression analysis was carried out.
ROC analysis was performed to assess the efficacy of DKI in assessing the renal damage in early-stage of CKD and determine the optimal cutoff value of each diffusion parameter. Using the de long method to evaluate the Areas Under Curves (AUCs). The AUCs with 95% Confidence Intervals (CIs), sensitivities and specificities of the ROC curves were calculated. P<0.05 was considered statistically significant.
Basic information
A total of 49 CKD patients and 18 healthy volunteers were included in this study. There was no significant difference in Scr and eGFR between the control group and the study group I (P>0.05). While Scr was significantly increased with eGFR significantly decreased in Study group II (P<;0.001). The demographic data, such as age, sex and BMI showed no difference among three groups.
The pathological categories of CKD patients were as follows: IgA nephropathy, 28 cases; Minor glomerular abnormalities, 2 cases; membranous nephropathy, 5 cases; anaphylactic purpura nephritis, 1 case; diabetic nephropathy, 4 cases; IgA nephropathy and diabetic nephropathy, 1 case; Minor glomerular abnormalities and tubular interstitial disease, 7 cases; cast nephropathy, 1 case (Table 3). The MK, MD and FA values differed among different pathological types, further significance analysis needed to be expanded to more cases.
| Pathological type of renal disease | Number of patients | Cortex | Medulla | ||||
|---|---|---|---|---|---|---|---|
| MD | MK | FA | MD | MK | FA | ||
| Minor glomerular abnormalities | 2 | 3.96 ± 0.07 | 0.38 ± 0.01 | 0.08 ± 0.01 | 3.85 ± 0.07 | 0.37 ± 0.01 | 0.10 ± 0.01 |
| Minor glomerular abnormalities And tubular interstitial disease |
7 | 3.94 ± 0.19 | 0.39 ± 0.02 | 0.08 ± 0.04 | 3.86 ± 0.26 | 0.39 ± 0.02 | 0.07 ± 0.04 |
| IgA nephropathy | 28 | 3.844 ± 0.22 | 0.39 ± 0.02 | 0.07 ± 0.01 | 3.76 ± 0.23 | 0.39 ± 0.02 | 0.07 ± 0.02 |
| Membranous nephropathy | 5 | 3.90 ± 0.21 | 0.39 ± 0.02 | 0.07 ± 0.02 | 3.77 ± 0.21 | 0.39 ± 0.02 | 0.08 ± 0.01 |
| Diabetic nephropathy | 4 | 3.82 ± 0.13 | 0.39 ± 0.01 | 0.05 ± 0.01 | 3.76 ± 0.09 | 0.39 ± 0.01 | 0.05 ± 0.01 |
| Cast nephropathy | 1 | 3.93 | 0.38 | 0.10 | 3.84 | 0.385 | 0.12 |
| IgA nephropathy and diabetic nephropathy | 1 | 3.58 | 0.42 | 0.06 | 3.51 | 0.42 | 0.06 |
| Anaphylactic purpura nephritis | 1 | 3.93 | 0.38 | 0.06 | 3.79 | 0.40 | 0.07 |
| MD: Mean Diffusivity; MK: Mean Kurtosis; FA: Fractional Anisotropy | |||||||
Table 3: DKI metrics in different pathological types of CKD patients (n=49).
Differences of DKI parameters among different groups
The renal parenchymal MD, MK and FA values of all participants conformed to a normal distribution, which showed almost no difference between the left and right kidneys (P>0.05). For all the participants, the cortical MD values were significantly higher than medulla, while the MK and FA values were significantly higher in the medulla than cortex (P<0.05).
Furthermore, in the renal cortex and medulla, MD and FA values in the CKD patients were significantly lower than in the control group, while MK values were significantly higher in the CKD patients than control group (P<0.05). More importantly, both two groups were compared to the control group regarding the MD and MK values: Cortex MD had a trend: Study group II
| Characteristics | Control group (n=18) | eGFR ≥ 90 mL/min (n=20) | eGFR<90 mL/min (n=29) | Pα | Pβ | Pγ |
|---|---|---|---|---|---|---|
| DKI metrics | ||||||
| MDCortex | 4.09 ± 0.20* | 3.95 ± 0.15* | 3.80 ± 0.21* | 0.02 | <0.01 | 0.01 |
| MKCortex | 0.37 ± 0.02* | 0.38 ± 0.02* | 0.40 ± 0.02* | 0.02 | <0.01 | <0.01 |
| FACortex | 0.10 ± 0.04 | 0.07 ± 0.02 | 0.07 ± 0.02 | <0.01 | <0.01 | 0.64 |
| MDMedulla | 3.93 ± 0.16 | 3.83 ± 0.18 | 3.74 ± 0.23 | 0.07 | <0.01 | 0.14 |
| MKMedulla | 0.38 ± 0.02 | 0.39 ± 0.02 | 0.40 ± 0.03 | 0.06 | <0.01 | 0.14 |
| FAMedulla | 0.12 ± 0.04 | 0.08 ± 0.02 | 0.07 ± 0.02 | <0.01 | <0.01 | 0.27 |
| Clinical data | ||||||
| BMI | 23.4 ± 3.3 | 23.6 ± 2.6 | 25.4 ± 3.6 | 0.82 | 0.06 | 0.06 |
| Scr, µmol/L | 61.99 ± 9.27 | 59.67 ± 10.99 | 140.76 ± 55.28 | 0.49 | <0.01 | <0.01 |
| Homocysteine, µmol/L | 10.16 ± 2.97 | 19.96 ± 14.28 | 0.01 | |||
| Uric acid, mg/dL | 0.79 ± 0.86 | 0.92 ± 1.10 | 0.67 | |||
| Hb, g/dL | 127.5 ± 16.79 | 131.93 ± 17.12 | 0.37 | |||
| eGFR, mL/min/1.73 m2 | 114.5 ± 11.7 | 113.6 ± 12.3 | 53.5 ± 18.3 | 0.82 | <0.01 | <0.01 |
| CCR, mL/min/1.73 m2 | 134.91 ± 28.14 | 63.88 ± 22.74 | <0.01 | |||
| eGFR: estimated Glomerular Filtration Rate; Scr: Serum creatinine; Hb: Hemoglobin; CCR: endogenous Creatinine Clearance Rate; αRepresents the comparison of parameters between control group and eGFR ≥ 90 mL/min βRepresents the comparison of parameters between control group and eGFR <90 mL/min γRepresents the comparison of parameters between eGFR ≥ 90 mL/min and eGFR <90 mL/min *P<0.05, compare with any other group by LSD method |
||||||
Table 4: Baseline clinical data and diffusion kurtosis imaging (DKI) parameters in each group.

Figure 3. Boxplot of renal parenchymal DKI metrics in the study group I, study group II and the control group.
Representative DKI metrics maps and pathological images of subjects in different groups are shown in Figure 4.

Figure 4. Typical DKI metrics maps and pathological images of subjects in different groups.
Case 1: (4a-4c): Female, 55 y, from the control group (Scr 53.0 μ mol/L, eGFR103.0 ml/min/1.73 m2). 4a: MDCortex: 4.333, Medulla: 4.072; 4b: MKCortex: 0.345, Medulla: 0.369; 4c: FACortex: 0.115, Medulla: 0.144.
Case 2: (4d-4i): Female, 53 y, from study group I (Scr 54.9 μ mol/L, eGFR103.2 ml/min/1.73 m2). 4d: MDCortex: 4.032, Medulla: 3.817; 4e: MKCortex: 0.371, Medulla: 0.393; 4f: FACortex: 0.145, Medulla: 0.146.
Case 3: (4j-4o): Male, 53 y, from study group II (Scr 121.6 μ mol/L, eGFR58.0 ml/min/1.73 m2). 4j: MDCortex: 3.363, Medulla: 3.280; 4k: MKCortex: 0.449, Medulla: 0.459; 4l: FACortex: 0.0548, Medulla: 0.0704.
Example of DKI metrics maps in a 55 y female healthy volunteer and DKI metrics maps and pathological images in a 53 y female CKD patient with normal renal function (Scr 54.9 μmol/L, eGFR 103.2 ml/min/1.73 m2) and a 53 y male CKD patient with abnormal renal function (Scr 121.6 μmol/L, eGFR 58.0 ml/min/1.73 m2). The maps of MD and MK showed significant difference in three subjects: parenchymal MD values: Study group II
Correlations between DKI parameters and clinicopathological characteristics
The correlations between the DKI metrics and clinicopathological characteristics were shown in Table 5 and Figure 5.
| MK | MD | FA | ||||||||||
|---|---|---|---|---|---|---|---|---|---|---|---|---|
| Cortex | Medulla | Cortex | Medulla | Cortex | Medulla | |||||||
| r | P | r | P | r | P | r | P | r | P | r | P | |
| CCR | -0.503** | <0.001 | -0.258 | 0.074 | 0.436** | 0.002 | 0.265 | 0.066 | 0.012 | 0.935 | 0.278 | 0.053 |
| eGFR | -0.480** | <0.001 | -0.302* | 0.013 | 0.452** | <0.001 | 0.302* | 0.013 | 0.159 | 0.198 | 0.450** | <0.001 |
| Scr | 0.561** | <0.001 | 0.396** | 0.001 | -0.516** | <0.001 | -0.392** | 0.001 | -0.127 | 0.305 | -0.376** | 0.002 |
| Uric-acid | 0.318* | 0.026 | 0.344* | 0.016 | -0.430** | 0.002 | -0.345* | 0.015 | -0.279 | 0.052 | -0.323* | 0.024 |
| Homocysteine | 0.570** | <0.001 | 0.442** | 0.004 | -0.572** | <0.001 | -0.446** | 0.004 | -0.027 | 0.870 | -0.226 | 0.160 |
| GS score | 0.270 | 0.061 | 0.065 | 0.659 | -0.234 | 0.106 | -0.074 | 0.612 | -0.108 | 0.459 | -0.423** | 0.002 |
| IF score | 0.405** | 0.004 | 0.204 | 0.160 | -0.373** | 0.008 | -0.216 | 0.137 | -0.062 | 0.673 | -0.343* | 0.016 |
| TA score | 0.376** | 0.008 | 0.170 | 0.249 | -0.354* | 0.014 | -0.184 | 0.211 | -0.083 | 0.574 | -0.340* | 0.018 |
| CV score | 0.243 | 0.092 | 0.165 | 0.257 | -0.206 | 0.155 | -0.161 | 0.270 | -0.041 | 0.778 | -0.252 | 0.081 |
| Interstitial inflammatory cell infiltration | 0.470** | 0.001 | 0.239 | 0.098 | -0.408** | 0.004 | -0.248 | 0.085 | -0.095 | 0.515 | -0.182 | 0.211 |
Table 5: Correlations between the DKI metrics and clinicopathological data.

Figure 5. The linear correlation between the eGFR and DKI metrics.
The statistically positive correlation was found between eGFR and MD, FA value (MDcortex r=0.452; FAmedulla r=0.450, both P<0.001) as well as between the Scr and the cortical MK value (r=0.561, P<0.001), while the negative correlation was found between eGFR and the cortical MK value ( r=-0.480, P< 0.001), as well as between the Scr and MD, FA value (MDcortex r=-0.516; FAmedulla r=-0.376, both P<0.05). The DKI parameters were more correlated with IF/TA score than GS/CV score. Moreover, the cortical MD and MK values showed certain correlations with Interstitial infammatory cell infiltration (MD: r=-0.480; MK: r=0.470, both P<0.05).
Diagnostic performance of DKI parameters
ROC curves of DKI parameters for evaluating the efficacy of DKI in assessing the renal damage in early stage of CKD patients with eGFR ≥ 90 ml/min/1.73 m2 were plotted in Figure 6. For distinguishing CKD patients with eGFR ≥ 90 ml/min/1.73 m2 from healthy volunteers, the AUC values of the cortex MD, MK were 0.752 and 0.752 respectively (Table 6). For pairwise comparisons of ROC curves, the difference in diagnostic power between cortical MD and MK values were not statistically significant (P>0.05).

Figure 6. The ROC curve analysis of cortical MD and MK values to distinguish between different groups.
| Control group VS. eGFR ≥ 90 | eGFR ≥ 90 VS. eGFR<90 | |||||||
|---|---|---|---|---|---|---|---|---|
| Parameters | AUC (95% CI) | Cut off | Sensitivity (%) | Specificity (%) | AUC (95% CI) | Cut off | Sensitivity (%) | Specificity (%) |
| MDCortex | 0.752 (0.593-0.912) | 4.04 | 84.2 | 58.8 | 0.763 (0.623-0.903) | 3.92 | 77.8 | 68.4 |
| MKCortex | 0.752 (0.594-0.911) | 0.37 | 94.7 | 47.1 | 0.787 (0.652-0.921) | 0.38 | 77.8 | 68.4 |
Table 6: Diagnostic performance of cortical MD and MK values.
Our investigation aimed to reveal the potential of DKI in assessing the renal damage in early-stage of CKD patients. The results of this research showed that lower MD and FA values, higher MK values in early stage of CKD patients with normal or slightly changed functional index. This finding suggested that the early microstructure changes and abnormally low water molecule diffusion in the renal cortex occurred prior to functional index detection. Consequently, DKI may have important clinical potential in the assessment of early stage of CKD.
In our study, there was no difference of DKI metric values between the rights and left kidneys statistically, which was comparable to previous studies [17]. For all the participants, the MD values were significantly higher in the cortex than medulla, while the MK and FA values were significantly lower in the cortex than medulla, which was probably related to the more complex structure of the renal medulla. And the renal medulla contains straight renal tubules and blood vessels, which restrict the water molecule diffusion [18,19].
Based on the fact that kidneys have strong compensatory capacity, the early stage of CKD is still in the compensatory stage. Integral renal function is maintained by a sequence of complex adaptive mechanisms such as structural hypertrophy in the remaining nephrons [20]. Therefore, there was no difference in renal function index between patients with early stage of CKD and the control group. However, our research showed that the cortical MD and MK values significantly differed between patients with early stage of CKD and the control group. Further research found the certain correlation between the cortical MD, MK values and IF/TA score and inflammatory cell infiltration. It is remarkable that, CKD, even in its early stage, has a trend towards interstitial fibrosis dominated by inflammatory cells [21]. It is generally considered that inflammatory cells can release cytokines, potentially influence the intrarenal microcirculatory regulation, causing focal ischemia, deposition of matrix proteins, and tubular injury, which promotes the interstitial fibrosis [22]. Our pathological findings from early stage of CKD patients were consistent with this theory: Most patients presented with some degree of glomerular sclerosis, interstitial multifocal fibrosis, inflammatory cell infiltration, multifocal tubular atrophy and degeneration of tubular epithelial cells. The inflammatory cells in the renal interstitium are activated and release cytokines to impair tubular re epithelialization, which results in the insufficient re epithelialization and leads to the tubular atrophy [23]. Meanwhile, the cytokines cause the damage to microvascular endothelial cells and alter the intrarenal microcirculatory blood flow distribution, which cause focal ischemia [24]. Furthermore, the cytokines stimulate myofibroblasts to synthesize a variety of Extracellular Matrix (ECM) components, enhance the activity of protease inhibitors and promote the deposition of matrix proteins, which may cause more irregular microenvironments [25]. It is believed that these early pathological changes in the kidneys restrict water diffusion in the extra cellular space and eventually deviating the motion of water molecules from Gaussian distribution [26,27]. Which might mean that DKI can reflect renal damage in early stage of CKD through the restricted diffusion of water molecules in microstructure?
Moreover, the cortical MD and MK values showed significant difference among study group I, study group II and the control group (P<0.05): Cortex MD had a trend: Study group II<study group I<control group, cortex MK had a trend: control group<study group I<study group II. The IF/TA score is consistent with the progression trend of CKD. As CKD progresses, more tubular atrophy, inflammatory cell infiltration and massive accumulation of ECM further aggravate the degree of interstitial fibrosis. In this research, the MK values of the renal cortex tended to increase with the progression of CKD, which demonstrated that the limitation of water diffusion is proportional to the complexity of the microenvironment. The limited movement of water molecules can be directly quantitatively reflected by the parameter values. Accordingly, DKI might be able to track the changes of renal microstructure during the progression of CKD.
Deviated from the previous studies, our study found that the correlation between the cortical MD, MK values and the IF/TA score were stronger than GS score. Repeated researches have proved that the tubulointerstitial damage plays a major role in the progression of CKD [28]. In the early stage of CKD, inflammatory cell infiltration and renal tubular atrophy make the tissue to has the more irregular and heterogeneous microenvironments. The tubulointerstitial damage will further lead to microvascular stenosis, increased vascular resistance, and decreased glomerular blood flow [29]. Therefore, DKI may be a potential non-invasive evaluation method for chronic tubulointerstitial disease that cannot be clinically assessed by measuring renal function indicators and urinalysis.
In terms of the diagnostic efficacy, both cortical MD and MK values can distinguish the CKD patients with eGFR ≥ 90 ml/min/1.73 m2 from the healthy volunteers. This result suggests that DKI may possess important clinical potential in the assessment of damage in early stage of CKD. In addition, our study initially found that DKI parameter values differed among different pathological types of CKD. This may be due to the different units and degrees of microstructural damage in patients with different pathological types. The value of DKI in distinguishing different pathological types can be further explored in the future.
There were some limitations in our research. First of all, our study is a preliminary single center research, large scale studies are needed to confirm our results. Furthermore, DKI was performed before kidney biopsy, and the further studies are required to confirm the potential of DKI to monitor the progress of CKD over time. Eventually, our study showed that DKI parameters might be used as an indicator for distinguishing pathological types of CKD, further research is required in the future.
To conclude, our study reveals that DKI is feasible for assessing the renal damage in early stage of CKD patients. Therefore, it is expected that DKI might be an effective and promising non-invasive method to guide the clinical treatment and follow up in CKD patients. In the future, more researches are needed to further support the value of DKI.
Not applicable.
All authors contributed to the study conception and design. Youjun Cao designed and performed the research; Jiazhen Lin wrote the original draft; Jiazhen Yin collected the cases and assisted in pathological diagnosis; Feng Cui and Xianjie Le provided technical and financial support; Hua Qu performed the data analysis; Yongsheng Zhang revised manuscript. All authors read and approved the final manuscript.
This work was supported by grants from the Basic Public Welfare Research Program of Zhejiang Province (Grant No. GF18H180031) and Zhejiang Traditional Chinese Medical Scientifc Technology (Grant No.2020ZA080).
This study was conducted in accordance with the declaration of Helsinki and was approved by the ethics committee of Hangzhou TCM Hospital Afliated to Zhejiang Chinese medical university (No. 2018KY002). All the patients (or their guardians in the case of minors) provided their written informed consent before data collection.
Select your language of interest to view the total content in your interested language