
Research Article - (2022) Volume 9, Issue 1
Received: 21-Feb-2022, Manuscript No. AJGRP-22-53360; Editor assigned: 24-Feb-2022, Pre QC No. AJGRP-22-53360 (PQ); Reviewed: 11-Mar-2022, QC No. AJGRP-22-53360; Revised: 18-Mar-2022, Manuscript No. AJGRP-22-53360 (R); Published: 25-Mar-2022
Through the interpretation of soil attributes it is possible to characterize the changes resulting from the adoption of different managements. The use of sustainable and conservationist production systems, such as the use of cover crops, has contributed to the improvement of the physical, chemical and biological attributes of the soil. This study aimed to analyze the effects of cover plants of the brachiaria (Urochloa ruziziensis), forage turnip (Raphanus sativus), crotalaria (Crotalaria juncea), millet (Pennisetum glaucum) versus mechanized operation with scarifier without soil cover on the attributes soil physicists with a history of five primary periodic soil preparation systems, used since 2014: P1-plowing harrow; P2-disc plow; P3-rotary hoe; P4-no-till; P4-scarifier. In the layers from 0.10 m to 0.20 m and from 0.20 m to 0.30 m, where soil compaction was found, the cover plants reduced on average 37.2% and 47.2% of the RMSP, respectively. In general, forage turnip was the species that stood out the most in improving soil density.
Soil physics, cover crops, soil preparation, porosity
Soil attributes can characterize the changes resulting from the adoption of different managements. The most used parameters in soil physical assessment are soil density and porosity (Carvalho, et al. 2014), particle density (Baptista, et al. 2017) and soil mechanical resistance to penetration (RMSP) (Tavares, et al. 2014).
The negative impacts on the physical quality of the soil as a result of agricultural mechanization makes tropical soils compact and, therefore, an unfavorable environment for the development of crops, in addition to the degradation of the environment, especially when there is excessive use of machinery in soil preparation. Although there is no consensus regarding the effects of compaction on the increase in aerial biomass of crops (Fenner, 2008), it is associated with many environmental and agronomic problems (Keller, 2012).
Agricultural mechanization generates greater operational capacity in the field and reduces the demand for labor, which can result in lower production costs. However, the excessive use of machines in the field causes losses in the porosity and permeability of the profile, reducing the infiltration and storage of water and hindering the growth and absorption of nutrients by the cultures. Supplement with information from the paragraph above and make the last sentence a hook for the next paragraph.
For the verification of soil compaction, it is necessary to have the characterization of its texture, in order to consider the critical values of density in the range of 1.45 g cm-3 for soils with more than 55% clay, 1.55 g cm-3 for soils with 55% to 20% clay and 1.65 g cm-3 for soils with less than 20% clay (Reinert, et al. 2001). Regarding the soil’s mechanical resistance to penetration, the critical values vary between 6 MPa and 7 MPa for sandy soils and 2.5 MPa for clayey soils (Sene, et al. 1985). The macroporosity has a lower limit of 0.10 cm³ cm-³ so that the roots can have satisfactory oxygenation for their growth (Reinert, et al. 2001).
The adoption of sustainable and conservationist production systems, such as the use of cover crops, has contributed to the improvement of physical, chemical and biological attributes of the soil, mainly due to the soil cover, which contribute to the reduction of compaction and erosion, minimizing the losses of water, soil and nutrients, in addition to promoting the accumulation of organic material on the soil surface and reduction of Green House Gas (GHG) emissions (Favarato, et al. 2015; Oliveira, et al. 2015; Colombo, et al. 2017). Cover crops provide phytomass on the soil surface and their plant residues can reduce the impact of rain and increase water infiltration (Guedes Filho, et al. 2013; Ambrosano, et al. 2014; Bettiol, 2014). In addition, growing cover crops in the off-season has a positive impact on increasing crop productivity, in addition to maintaining straw and increasing agricultural productivity (Dias, et al. 2015).
The use of cover crops, due to the penetration of the root system, allows the soil to be decompacted without the need to turn it over (Severiano, et al. 2010; Santos, et al. 2014). Aggregating crops with an aggressive root system can minimize the negative effects of soil degradation through improvements in its structure (Cunha, et al. 2011). The roots of cover crops play a key role in improving and structuring the soil. The construction of the soil profile is important, but its effects on agricultural productivity are still poorly recognized (EMBRAPA, 2017). In a literature review on the cost-effectiveness of compaction mitigation technologies, concluded that mechanized operations have an expensive economic cost for farmers (Tim Chamen, et al. 2014).
Knowledge of edaphic conditions and soil quality can help in evaluating the quality of the recovery process and proper soil management. Most studies consider only plant development however, the physical characteristics of the soil must be treated with care because they can be the main limitations in areas where fertility is already corrected and can be monitored by several parameters (Long, et al. 2011). Conservation practices are important for sustainable agriculture, in order to eliminate or reduce soil disturbance and use cover crops that stimulate the activity of the microbiota of the soil and increases the stock of organic carbon (Silva, 2020). Cover plants have the function of biological soil decompaction, breaking the layer that is more uniformly compacted, different from what happens with the use of subsoilers (Camargo, et al. 1997; Aita, et al. 2003). In addition, the aggressive root system of cover crops extracts nutrients and after their accumulation there is decomposition and gradual release in the soil (Fiorin, 1999).
From this, this study aims to analyze the effects of cover crops of brachiaria species (Urochloa ruziziensis), radish (Raphanus sativus), sunn hemp (Crotalaria juncea), and millet (Pennisetum glaucum) versus mechanized operation with a chisel on the physical attributes of the soil with a history of different types of soil preparation.
History of the area and characterization of the experimental area
The work was developed in the experimental area of the Federal University of Vicosa, campus of Rio Paranaiba, with an altitude of 1128 m, located in the geographical position (19˚12’43” S and 46˚07’56” W). The area belongs to the São Francisco River basin, Alto Paranaiba region, municipality of Rio Paranaiba (MG).
The municipality has a humid temperate climate, being classified by the Köppen scale as Cwb. This climate is characterized by having two very well defined seasons, with a moderately hot and rainy summer and a dry and cold winter.
The average annual temperature is 20.4˚C and the average annual rainfall of 1570 mm.
The experimental area has a history containing the different types of preparation since the year 2014 in which it was previously formed with pasture (brachiaria). Each year, after preparing the soil, crops were grown in the area: soybeans in 2014, corn for grain production in 2015 and corn for silage production in 2016 and 2017. In 2018, beans were cultivated, with conventional primary tillage with heavy harrow throughout the area. During the year 2019, until the installation of the experiment in the subplots (October 2019), the area was left fallow with cover of weeds and brachiaria.
For the installation of the subplots, the control of weeds and brachiaria, after the fallow, was done through a mowing and an application of glyphosate (4 L/ha).
Installation of subplots
A completely randomized design (DIC) was used in a split-plot design with four replications. The plots contained the five main treatments with previously adopted periodic primary soil tillage systems (preparation history since 2014) using: P1-harrow; P2-disc plow; P3-rotary hoe; P4-no-tillage; P4-scarifier. The subplots, installed in October 2019, included four cover crops brachiaria (Urochloa ruziziensis), radish (Raphanus sativus), sunn hemp (Crotalaria juncea), millet (Pennisetum glaucum) and a treatment with mechanized operation (control), characterized by mechanical scarifier without ground cover. The plots had dimensions of 10 m in length per 10 m wide and were divided into 2 m wide and 10 m long subplots. Within the subplots, the evaluated layers of 0.0 m up to the layer of 0.40 m for density and porosity and even 0.60 m for mechanical resistance of the soil to penetration, with evaluation of 0.10 m to 0.10 m (RMSP).
After controlling weeds and brachiaria with mowing and application of glyphosate, the sowing of the four cover species was carried out manually at the beginning of the rainy season of 2019 after opening the planting furrow, with a no-tillage seeder and chemical fertilization base. The spacing between rows was 0.50 m and the planting density was 20 seeds/m for radish and brachiaria, 30 seeds/m for sunn hemp and 60 seeds/m for millet. The base fertilization was carried out in the furrows at a dose of 215 kg/ha of the formula 08-28-16. At 90 days after planting, the cover crops were mowed with a mower mounted on the three points of the tractor for the evaluation of the physical attributes of the soil hello and later sand re carry out the planting of the corn crop.
Evaluation of the physical attributes of the soil
Density: Undisturbed soil sampling was carried out in each experimental unit before fallow and after cover crops was grown. Sampling was performed with an Uhland auger, with a 100 cm³ volumetric ring. In this study, the density was determined in 0.10 m layers along the profile up to the 0.40 m layer by the volumetric ring method (Donagema, 2011).
After collecting the samples, the volumetric rings were identified, sealed with porous fabric and fixed with rubber and plastic lids, placed in Styrofoam boxes and taken to the laboratory for analysis. Density was determined after porosity evaluations on the same undisturbed samples taken in the experiment. The samples after saturation and suction on a tension table for the determination of macroporosity, microporosity and total porosity were placed in a forced ventilation oven at a temperature of 105˚C until constant mass was obtained. After drying, the samples were weighed on a 0.01 g precision balance to obtain the dry mass of the soil and the density was calculated (Equation 1), with values expressed in g.cm&sup-3;, discounting the ring mass, volumetric, porous fabric and rubber that fixed it.
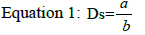
Ds=Soil density (g.cm-3)
a=Mass of the dry sample at 105˚C (g)
b=Volume of the volumetric ring (cm³)
Porosity: For porosity evaluation, the same undisturbed samples collected for density determination were used. Total porosity was determined by calculating the ratio between the density of the oven-dried soil and the particle density (Equation 2) determined by the volumetric flask method (Donagema, 2011). Particle density consists of determining the volume of alcohol needed to fill the capacity of a 50 mL volumetric flask containing 20 g of soil. In the calculation of the density of particles one has that:
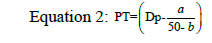
Dp=Particle density (g.cm-3)
a=Mass of the dry sample at 105˚C (g)
b=Volume of alcohol spent (cm-3)
After determining the density of particles and density of the dry soil, the total porosity is calculated in (Equation 3).
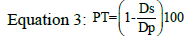
PT=Total porosity percentage (cm³.cm-³)
Ds=Soil density (g.cm-3)
Dp= Particle density (g.cm-3)
The microporosity is defined by the volume of water that is removed in the micropores of the undisturbed samples (Equation 4) that are submitted to a suction of 6 kPa in the tension table (Donagema, 2011). The determination of the water mass of the micropores is obtained by weighing the mass of the sample after an equilibrium time of 24 h and is discounted from the dry soil mass. This gives the formula for calculating microporosity:
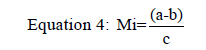
Mi= Microporosity (cm³.cm-3)
a=Mass of the sample-cylinder-fabric-rubber assembly after equilibrium at 6 kPa (g)
b=Dry soil mass at 105˚C (g)
c=Volume of the volumetric ring (cm³)
Macroporosity, in turn, is given by the difference between total porosity and microporosity in (Equation 5).
Equation 5: Ma=(PT-Mi)
Ma=Macroporosity (cm³.cm-3)
PT=Total porosity (cm³.cm-3)
Mechanical resistance of soil to penetration: To determine the RMSP before and after the cultivation of cover crops, an impact penetrometer model IAA/Planalsucar-Stolf, type 2 conical tips, with a diameter of 12.83 mm and a solid angle of 30˚, standard plunger of 4 kg and height for vertical displacement of the plunger of 0.40 m (Asae, 1999). In the determination made before the cultivation of cover crops, three profiles were evaluated per experimental unit, in layers of 0.10 m to a depth of 0.60 m, to determine the RMSP and the average value in each layer was used to represent each parcel. All RMSP evaluations took place on the same day and on the side where the undisturbed soil samples were obtained to evaluate soil density and moisture.
The results obtained with the impact penetrometer, provided in “cm impact-1”, were transformed into kgf cm-2, according to equation 1 (Stolf, 1991) and subsequently multiplied by the factor 0.098 to transform the mechanical strength of the soil to penetration in MPa (Equation 6).
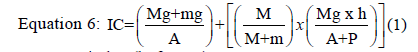
CI=Cone index (kgf.cm-2)
Mg=Mass of piston weight (kgf)
mg=Mass of the penetrometer without the plunger (kgf)
A=Area of the base of the cone (cm²)
M=Mass of piston (kg)
m=Mass of the penetrometer without the plunger (kg)
h=Plunger drop height (cm)
P=Unit penetration caused by an impact (cm)
At the end of the establishment of the coverage plans, the verification of the RMSP was carried out again with the same methodology previously along the profile in layers of 0.10 m to a depth of 0.60 m. The evaluation was carried out with the same impact penetrometer used for the characterization prior to the installation of the experiment. Four profiles were evaluated for each subplot containing the cover crops on the different soil preparations, totaling 400 sampling points. All points were sampled on the same day and during the rainy season in which the soil moisture was completely homogeneous along the profile, without the possibility of any variation in the RMSP due to this, leading to erroneous interpretations of this physical attribute of the soil ground.
Statistical analysis
The data were submitted to the Levene, Jarque-Bera (Jarque, et al. 1980) and Generalized ESD (Rosner, 1983) tests to evaluate the conditions of homogeneity of variances, normality of residuals and presence of outliers, respectively. Data analysis of variance was performed, and the means were compared by the Student Newman-Keuls (SNK) test at 5% probability when there were significant differences found by the F-test. The statistical tests were performed using the SPEED Stat software (Carvalho, et al. 2017).
Before the cultivation of cover crops, it was verified that the density was obtained from 1.02 g cm-3 to 1.05 g cm-3 in the layer from 0.10 m to 0.20 m and from 1.21 g cm-3 to 1.25 g cm-3 in the 0.20 m to 0.30 m layer. The RMSP values in the 0.20 m to 0.30 m layer are above the critical value of 2.5 MPa, being in the range of 2.46 MPa to 3.37 MPa (Davies, et al. 1991; Tardieu, 1994). Also for tillage with rotary hoe and no-tillage, compaction was observed in the layer from 0.10 m to 0.20 m, obtaining 2.63 MPa and 2.92 MPa, respectively (Table 1).
| Depth (m) | preparation systems | |||||
|---|---|---|---|---|---|---|
| GA | ES | AD | PD | ER | CV (%) | |
| Ds (g cm-3) | ||||||
| 0.00-0.10 | 1.10 bA | 1.09 cA | 1.05 cA | 1.08 bA | 1.02 bA | 4.17 |
| 0.10-0.20 | 1.23 aA | 1.25 aA | 1.24 aA | 1.22 aA | 1.21 aA | 4.11 |
| 0.20-0.30 | 1.22 aA | 1.22 abA | 1.25 aA | 1.22 aA | 1.21 aA | 3.51 |
| 0.30-0.40 | 1.20 aA | 1.22 abA | 1.22 aA | 1.20 aA | 1.17 aA | 2.69 |
| 0.40-0.50 | 1.15 abA | 1.18 abA | 1.18 abA | 1.17 abA | 1.14 aA | 2.86 |
| 0.50-0.60 | 1.16 abA | 1.17 bcA | 1.12 bcA | 1.16 abA | 1.15 aA | 3.38 |
| M | RMSP (MPa) | |||||
| 0.00-0.10 | 0.83 cA | 1.06 bA | 0.72 cA | 1.28 cA | 0.83 bA | 20.42 |
| 0.10-0.20 | 2.07 aba | 2.24 abA | 2.24 abA | 2.92 abA | 2.63 aA | 19.63 |
| 0.20-0.30 | 2.47 aB | 2.46 aB | 2.63 aAB | 3.37 aY | 2.86 aAB | 14.4 |
| 0.30-0.40 | 2.41 aA | 2.41 aA | 2.01 bA | 2.92 abA | 2.69 aA | 19.07 |
| 0.40-0.50 | 1.96 abA | 1.84 abA | 1.96 bA | 2.13 bcA | 2.13 aA | 14.95 |
| 0.50-0.60 | 1.73 bA | 1.73 abA | 1.73 bA | 2.07 bcA | 2.01 aA | 18.92 |
| M | U% | |||||
| 0.00-0.10 | 32.82 aA | 31.95 aA | 31.72 aA | 29.83 aA | 30.91 aA | 12.64 |
| 0.10-0.20 | 31.11 aA | 30.88 aA | 31.69 aA | 31.24 aA | 30.96 aA | 7.51 |
| 0.20-0.30 | 31.48 aA | 30.69 aA | 31.33 aA | 31.53 aA | 30.76 aA | 7.73 |
| 0.30-0.40 | 31.42 aA | 31.68 aA | 31.77 aA | 31.98 aA | 31.84 aA | 7.44 |
| 0.40-0.50 | 33.62 aA | 32.60 aA | 33.22 aA | 33.23 aA | 33.02 aA | 5.46 |
| 0.50-0.60 | 34.02 aA | 33.75 aA | 34.65 aA | 33.48 aA | 33.80 aA | 4.95 |
Note: Uppercase letters in the row and lowercase letters in the column do not differ from each other by SNK to 5%. |
||||||
Such results are related to the penetration capacity of soil preparation equipment, where the rotary hoe penetrates only up to 0.10 m of depth and the other equipment can penetrate below this depth, forming a compacted layer at a depth of 0.20 m. In the no-tillage system, the verification of compaction in the layer from 0.10 m to 0.20 m is due to the influence of the passes of the tractor wheels over time without soil preparation.
The soil’s mechanical resistance to penetration proved to be more sensitive than the soil density in the evaluation of a possible compaction. Note that the upper layer showed low DS and RMSP values, possibly due to the action of organic matter. Still, in general, these values were similar to those found in the layer below 0.40 m, which can be explained by the smaller effect of organs active organs of agricultural equipment used at greater depths. These results were also observed by (Gamero, et al. 1990). This conclusion can be taken from the homogeneity of humidity in which there was no significant difference between the evaluated layers, not interfering with the penetration of the penetrometer rod throughout the profile up to the last layer. It was observed that the cover crops decompacted the soil, considerably reducing all RMSP values (Table 2).
Portion |
GA | ES | AD | PD | ER | *mm | CV% |
|---|---|---|---|---|---|---|---|
Subplot |
0.00 m to 0.10 m | 25.14% | |||||
millet |
1.07 Aa | 1.41 Aab | 1.58 Aa | 1.32 Aa | 1.32 Aa | ||
Brachiaria |
1.32 Aa | 1.32 Aab | 1.49 Aa | 1.41 Aa | 1.49 Aa | ||
Crotalaria |
1.49 Aa | 1.24 Ab | 1.49 Aa | 1.41 Aa | 1.41 Aa | ||
fodder turnip |
1.15 Aa | 1.66 Aab | 1.49 Aa | 1.41 Aa | 1.41 Aa | ||
scarifier |
1.49 Aa | 1.75 Aa | 1.41 Aa | 1.58 Aa | 1.26 Aa | ||
mm |
|||||||
| 0.10 m to 0.20 m | 12.42% | ||||||
Brachiaria |
1.66 Aa | 1.75 Aab | 1.75 Ab | 1.83 Aa | 1.83 Aa | ||
fodder turnip |
1.91 ABa | 1.99 Aa | 1.66 Bb | 1.75 ABa | 1.83 ABa | ||
Crotalaria |
1.83 Aa | 1.49 Bb | 1.83 Aab | 1.83 Aa | 1.66 Ba | ||
millet |
1.66 Ba | 1.66 Bb | 2.04 Aa | 1.91 ABa | 1.66 Ba | ||
scarifier |
1.66 Aa | 1.75 Aab | 1.66 Ab | 1.75 Aa | 1.83 Aa | ||
mm |
|||||||
| 0.20 m to 0.30 m | 17.86% | ||||||
Brachiaria |
2.00 | 1.75 | 2.08 | 1.91 | 2.00 | 1.95 a | |
fodder turnip |
1.91 | 2.00 | 1.83 | 1.75 | 2.25 | 1.95 a | |
Crotalaria |
1.75 | 2.00 | 2.08 | 1.75 | 2.00 | 1.91 a | |
millet |
2.00 | 2.08 | 2.08 | 1.66 | 1.91 | 1.95 a | |
scarifier |
1.91 | 2.00 | 1.91 | 1.66 | 2.20 | 1.94 a | |
mm |
1.92 A | 1.96 A | 2.00 A | 1.75 A | 2.07 A | ||
| 0.30 m to 0.40 m | 19.67% | ||||||
Brachiaria |
1.66 Aa | 1.66 Aa | 1.58 Aa | 1.58 Aab | 2.00 aa | ||
fodder turnip |
1.75 Aa | 1.75 Aa | 1.58 Aa | 1.49 Aab | 1.75 Aa | ||
Crotalaria |
1.49 Aa | 1.75 Aa | 1.83 Aa | 1.41 Ab | 1.83 Aa | ||
millet |
1.75 Aa | 1.49 Aa | 1.66 Aa | 1.66 Aab | 1.58 Aa | ||
scarifier |
1.58 Aa | 1.91 Aa | 1.58 Aa | 1.91 Aa | 1.66 Aa | ||
mm |
|||||||
| 0.40 m to 0.50 m | 24.88% | ||||||
Brachiaria |
1.58 | 1.49 | 1.15 | 1.24 | 1.49 | 1.39 a | |
fodder turnip |
1.15 | 1.49 | 1.24 | 1.24 | 1.41 | 1.31 a | |
Crotalaria |
1.24 | 1.32 | 1.24 | 1.07 | 1.58 | 1.29 a | |
millet |
1.49 | 1.41 | 1.49 | 1.41 | 1.32 | 1.42 a | |
scarifier |
1.32 | 1.24 | 1.32 | 1.24 | 1.26 | 1.28 a | |
mm |
1.36 A | 1.39 A | 1.29 A | 1.24 A | 1.41 A | ||
| 0.50 m to 0.60 m | 9.97% | ||||||
Brachiaria |
0.99 | 0.99 | 0.99 | 0.99 | 1.07 | 1.00 a | |
fodder turnip |
0.99 | 0.99 | 0.99 | 1.07 | 1.07 | 1.00 a | |
Crotalaria |
0.99 | 0.99 | 0.99 | 1.28 | 1.07 | 1.02 a | |
millet |
0.99 | 0.99 | 0.99 | 0.99 | 1.07 | 1.00 a | |
scarifier |
0.99 | 0.99 | 0.99 | 0.99 | 0.99 | 0.99 a | |
mm |
0.99 A | 0.99 A | 0.99 A | 1.00 A | 1.05 A | ||
Note : *mm=marginal means when there is no interaction between treatments.AD (disc plough), GA (harrow to harrow values), ES (scarifier), ER (rotary hoe) and no PD (no-tillage). Means followed by the same letter, uppercase in the line and lowercase in the column, do not differ from each other by the SNK test at 5%. |
|||||||
In the 0.10 m to 0.20 m layer, where values of 2.92 MPa for PD and 2.63 MPa for ER were previously observed, but after the cultivation of cover crops, values between 1.66 MPa to 1.91 MPa for these treatments, verifying an average reduction of 37.2%. In the 0.20 m to 0.30 m layer, previous RMSP values were between 3.37 MPa and 2.86 MPa. However, after the cultivation of cover crops, the SPMR was in the range of 1.66 MPa to 1.91 MPa for PD and 2.25 and 1.91 MPa for ER. This means an average reduction of 47.2% in PD and 27.3% in RE. There was no significant difference between treatments in the layers from 0.40 m to 0.50 m and 0.50 m to 0.60 m. There is no exact consensus on the critical level of RMSP (Betioli Júnior, et al. 2012) due to the dependence on moisture for its assessment, sampling time, collection day period (Peixoto, et al. 2019), soil type, management practices and type of penetrometer used (Alesso, et al. 2017). However, most results in the literature indicate root growth impediment from 2.5 MPa onwards. In the layer from 0.00 m to 0.10 m, although there was no statistical difference between the cover crops within each soil preparation, in the preparation with GA, the forage radish reduced 45.45% in density from 1.10 g cm-3 to 1, 05 g cm-3 (Table 3).
Portion |
|
GA | AD | ER | PD | ES | *mm | CV% | |
|---|---|---|---|---|---|---|---|---|---|
Subplot |
|
Ds(g/cm³) | 5.72% | ||||||
Brachiaria |
|
1.05 Aa | 1.07 Aa | 1.07 Aa | 1.07 Aa | 1.01 Aa | |||
fodder turnip |
|
1.02 Ba | 1.10 Aa | 1.05 ABa | 1.07 ABa | 1.07 ABa | |||
Crotalaria |
|
1.10 Aa | 1.05 Aa | 1.08 Aa | 1.08 Aa | 1.04 Aa | |||
millet |
|
1.09 Aa | 1.04 Aa | 1.06 Aa | 1.06 Aa | 1.08 Aa | |||
scarifier |
|
1.08 Aa | 1.08 Aa | 1.05 Aa | 1.05 Aa | 1.06 Aa | |||
mm |
|
||||||||
|
micro (cm³/cm³) | 18.08% | |||||||
Brachiaria |
|
0.46 | 0.50 | 0.48 | 0.51 | 0.46 | 0.48 a | ||
fodder turnip |
|
0.46 | 0.47 | 0.46 | 0.46 | 0.45 | 0.46 a | ||
Crotalaria |
|
0.48 | 0.43 | 0.45 | 0.44 | 0.42 | 0.44 a | ||
millet |
|
0.48 | 0.46 | 0.45 | 0.47 | 0.47 | 0.46 a | ||
scarifier |
|
0.48 | 0.47 | 0.46 | 0.47 | 0.47 | 0.47 a | ||
mm |
|
0.47 A | 0.46 A | 0.46 A | 0.47 A | 0.45 A | |||
|
macro (cm³/cm³) | 4.76% | |||||||
Brachiaria |
|
0.16 Aa | 0.11 Aa | 0.12 Aa | 0.09 Aa | 0.21 Aa | |||
fodder turnip |
|
0.20 Aa | 0.10 Aa | 0.17 Aa | 0.14 Aa | 0.15 Aa | |||
Crotalaria |
|
0.10 Aa | 0.19 ABa | 0.15 ABa | 0.11 ABa | 0.22 ABa | |||
millet |
|
0.10 Aa | 0.18 Aa | 0.19 Aa | 0.15 Aa | 0.12 Aa | |||
scarifier |
|
0.12 Aa | 0.13 Aa | 0.20 Aa | 0.15 Aa | 0.14 Aa | |||
mm |
|
||||||||
|
EN (cm³/cm³) | 2.65% | |||||||
Brachiaria |
|
0.62 Aa | 0.61 Aa | 0.60 Aa | 0.60 Aa | 0.67 Aa | |||
fodder turnip |
|
0.66 Aa | 0.57 Ba | 0.63 ABa | 0.60 ABa | 0.60 ABa | |||
Crotalaria |
|
0.57 Aa | 0.62 Aa | 0.60 Aa | 0.55 Aa | 0.64 Aa | |||
millet |
|
0.57 Aa | 0.64 Aa | 0.64 Aa | 0.62 Aa | 0.59 Aa | |||
scarifier |
|
0.60 Aa | 0.60 Aa | 0.66 Aa | 0.62 Aa | 0.61 Aa | |||
mm |
|
||||||||
Note: *mm=marginal means when there is no interaction between treatments. |
|||||||||
|
|
||||||||
In the most superficial layer of the soil, there was no interaction between treatments for microporosity, although such values are within the ideal considering the critical values, as pointed out (Michelon, et al. 2009). Regarding the total porosity, there was no difference between the cover crops; however the treatment with GA and forage radish had the highest PT, reaching 0.66 cm³/cm³. The ground cover retains its structure and the removal of this cover results in an increase in density (Jat, et al. 2017). Studying wheat cultivation in a dystrophic Red Latosol with 50% clay found a productivity reduction of 18% where the density was 1.62 g cm-3 (Silva, 2003). For these experimental conditions and for the same type of soil, the highest density was 1.10 g cm-3.
According to (Fonseca, et al. 2007), the density is not influenced by soil moisture and the critical value is 1.40 g cm-3, where values above this limit the development of the plant’s root system. (Reinert, et al. 2001) pointed out that for a soil with 55% to 20% the critical value is 1.55 g cm-3. In addition, a high density also negatively influences soil infiltration and the transport of water and gases (Fonseca, et al. 2007). As for macroporosity, considering that values lower than the critical value of 0.10 dm dm-1 (Reinert, et al. 2001; Vomocil, et al. 1966) implies the lack of oxygenation of the roots, the results are within the ideal. For the experiment in question, the macroporosity was in the range of 0.10 cm³/cm³ to 0.22 cm³/cm³, being ideal for the oxygenation of the plants. Cover crops also reduced soil density in the 0.10 m to 0.20 m layer (Table 4).
Portion |
GA | AD | ER | PD | ES | *mm | CV% |
|---|---|---|---|---|---|---|---|
Subplot |
Ds (g/cm³) | 3.87% | |||||
Brachiaria |
1.05 Aa |
1.06 Ab |
1.08 Aa |
1.12 Aa |
1.10 Ab |
|
|
fodder turnip |
1.07 Ba |
1.12 Aa |
1.13 Aa |
1.12 Aa |
1.18 Aa |
|
|
Crotalaria |
1.10 Aa |
1.16 Aa |
1.14 Aa |
1.12 Aa |
1.13 Aab |
|
|
millet |
1.07 Ba |
1.11 ABab |
1.14 Aa |
1.12 Aa |
1.13 Aab |
|
|
scarifier |
1.07 Aa |
1.13 Aa |
1.13 Aa |
1.12 Aa |
1.12 Ab |
|
|
mm |
|
|
|
|
|
||
| micro (cm³/cm³) | 4.13% | ||||||
Brachiaria |
0.41 | 0.45 | 0.44 | 0.47 | 0.40 | 0.43 a | |
fodder turnip |
0.37 | 0.46 | 0.45 | 0.44 | 0.45 | 0.43 a | |
Crotalaria |
0.40 | 0.43 | 0.46 | 0.46 | 0.46 | 0.44 a | |
millet |
0.44 | 0.41 | 0.48 | 0.43 | 0.45 | 0.44 a | |
scarifier |
0.43 | 0.44 | 0.48 | 0.50 | 0.46 | 0.48 a | |
mm |
0.41 A | 0.44 A | 0.46 A | 0.48 A | 0.44 A | ||
| macro (cm³/cm³) | 2.82% | ||||||
|
|||||||
Brachiaria |
0.13 Aa | 0.06 Aa | 0.08 Aa | 0.09 Aa | 0.06 Ba | ||
fodder turnip |
0.19 Aa | 0.13 Ba | 0.09 Ba | 0.11 Ba | 0.12 Ba | ||
Crotalaria |
0.18 Aa | 0.11 Ba | 0.10 Ba | 0.13 ABa | 0.11 Ba | ||
millet |
0.17 Aa | 0.11 ABa | 0.11 ABa | 0.09 Ba | 0.17 Aa | ||
scarifier |
0.07 Ab | 0.10 Aa | 0.10 Aa | 0.07 Aa | 0.18 Aa | ||
mm |
|||||||
| EN (cm³/cm³) | 1.91% | ||||||
Brachiaria |
0.54 Aa | 0.51 Aa | 0.52 Aa | 0.56 Aa | 0.46 Aa | ||
fodder turnip |
0.56 Aa | 0.59 Bb | 0.54 Ba | 0.55 Ba | 0.57 Bb | ||
Crotalaria |
0.58 Aa | 0.54 Ab | 0.56 Aa | 0.59 Aa | 0.57 Aab | ||
millet |
0.61 Aa | 0.52 ABab | 0.59 Ba | 0.52 Ba | 0.62 Bab | ||
scarifier |
0.50 Aa | 0.54 Ab | 0.58 Aa | 0.57 Aa | 0.64 Aa | ||
mm |
|||||||
Note: *mm=marginal means when there is no interaction between treatments. |
|||||||
In the layer of 0.10 m to 0.20 m, values between 1.05 g cm-3 and 1.18 g cm-3 were observed with the conduction of the cover plants and between 1.21 g cm-3 and 1.25 g cm-3 before installation of the experiment with these plants. This indicates an average reduction of 9.75%. There was no difference in soil microporosity for all treatments. The macroporosity was higher with the plow harrow and lower with the scarifier (Souza, et al. 2005).
In the layer from 0.20 m to 0.30 m there was interaction between treatments in all attributes evaluated (Table 5).
|
GA | AD | ER | PD | ES | *mm | CV% |
|---|---|---|---|---|---|---|---|
Subplot |
Ds (g/cm³) | 4.06% | |||||
Brachiaria |
1.04 Ba | 1.07 Bb | 1.14 Aa | 1.12 Aa | 1.13 Aab | ||
fodder turnip |
1.05 Ca | 1.13 ABa | 1.13 ABa | 1.08 Ba | 1.15 Aab | ||
Crotalaria |
1.04 Ba | 1.11 Aab | 1.10 Aa | 1.11 Aa | 1.11 Aab | ||
millet |
1.00 Ca | 1.09 Babe | 1.13 ABa | 1.09 Ba | 1.17 Aa | ||
scarifier |
1.05 Ba | 1.14 Aa | 1.13 Aa | 1.10 Aa | 1.11 Ab | ||
mm |
|||||||
| micro (cm³/cm³) | 5.87% | ||||||
|
|||||||
Brachiaria |
0.42 Aa | 0.40 Aa | 0.42 Aa | 0.48 Aa | 0.43 Aa | ||
fodder turnip |
0.41 Aa | 0.41 Aa | 0.42 Aa | 0.42 Aa | 0.45 Aa | ||
Crotalaria |
0.40 Aa | 0.40 Aa | 0.43 Aa | 0.47 Aa | 0.48 Aa | ||
millet |
0.46 Aa | 0.42 Aa | 0.44 Aa | 0.45 Aa | 0.42 Aa | ||
scarifier |
0.42 Aa | 0.41 Aa | 0.44 Aa | 0.32 Bb | 0.41 Aa | ||
mm |
|||||||
| macro (cm³/cm³) | 5.56% | ||||||
Brachiaria |
0.19 Aa | 0.24 Aa | 0.19 Aa | 0.08 Bb | 0.06 Ba | ||
fodder turnip |
0.24 Aa | 0.24 Aa | 0.18 Aa | 0.15 Aa | 0.13 Bab | ||
Crotalaria |
0.23 Aa | 0.24 Aa | 0.14 Ba | 0.11 Bab | 0.08 Ba | ||
millet |
0.16 Aa | 0.24 Aa | 0.08 Ba | 0.07 Bab | 0.14 Bab | ||
scarifier |
0.21 Aa | 0.24 Aa | 0.13 Ba | 0.23 Aa | 0.18 Aa | ||
mm |
|||||||
| EN (cm³/cm³) | 1.98% | ||||||
Brachiaria |
0.61 Aa | 0.64 Aa | 0.61 Ba | 0.56 Ba | 0.49 Bab | ||
fodder turnip |
0.65 Aa | 0.65 Aa | 0.60 BC | 0.57 Ba | 0.58 Aab | ||
Crotalaria |
0.63 Aa | 0.64 Aa | 0.57 Ba | 0.58 Ba | 0.56 Bab | ||
millet |
0.62 Aa | 0.66 Aa | 0.57 Ba | 0.52 Ba | 0.56 Bb | ||
scarifier |
0.63 Aa | 0.65 Aa | 0.57 Ba | 0.55 Ba | 0.56 Ba | ||
mm |
|||||||
Note: *mm= marginal means when there is no interaction between treatments. |
|||||||
The harrow obtained the best density values in two types of soil cover. In the cover with millet the density was 1 g cm-3 and in the forage radish it was 1.05 g cm-3. For this preparation, millet reduced 18% and forage radish 14% in relation to the condition prior to their cultivation. The positive influence of grasses on soil structuring has been demonstrated in many studies (Rashid, et al. 2016; Naresh, et al. 2017). Millet has vigorous and abundant roots, providing a good effect in this aspect (Passot, et al. 2016). The lowest microporosity was found in the PD and scarifier without ground cover.
Compaction is usually more easily observed in the layer between 0.20 m and 0.30 m, due to the action of organs active parts of the equipment being regulated to act up to a depth of 0.20 m during conventional preparation, over several years of cultivation, resulting in the so-called “harrow foot”, “plow foot”, or “sill”. The increase in microporosity concomitantly with the reduction in macroporosity is characteristic of probable compaction (Fonseca, et al. 2007). As there was no evidence of this behavior, there was no compression. In addition, observing the values prior to the installation of the experiment, the cover crops promoted a decrease in soil density, showing to be a good alternative for the improvement of this attribute. In the layer from 0.30 m to 0.40 m there were also significant reductions in soil density with the use of cover crops, mainly in the preparations with harrow and scarifier (Table 6).
|
GA | AD | ER | PD | ES | *mm | CV% |
|---|---|---|---|---|---|---|---|
Subplot |
Ds (g/cm³) | 5.08% | |||||
Brachiaria |
1.05 Aa | 1.06 Ab | 1.08 Aa | 1.12 Aa | 1.10 Ab | ||
fodder turnip |
1.07 Ba | 1.12 Aa | 1.13 Aa | 1.12 Aa | 1.18 Aa | ||
Crotalaria |
1.10 Aa | 1.16 Aa | 1.14 Aa | 1.12 Aa | 1.13 Aab | ||
millet |
1.07 Ba | 1.11 ABab | 1.14 Aa | 1.12 Aa | 1.13 Aab | ||
scarifier |
1.07 Aa | 1.13 Aa | 1.13 Aa | 1.12 Aa | 1.12 Ab | ||
mm |
|||||||
| micro (cm³/cm³) | 18.21% | ||||||
Brachiaria |
0.41 | 0.42 | 0.42 | 0.43 | 0.41 | 0.42 a | |
fodder turnip |
0.45 | 0.44 | 0.43 | 0.43 | 0.41 | 0.43 a | |
Crotalaria |
0.40 | 0.44 | 0.42 | 0.43 | 0.41 | 0.42 a | |
millet |
0.46 | 0.43 | 0.44 | 0.42 | 0.43 | 0.44 a | |
scarifier |
0.42 | 0.48 | 0.44 | 0.43 | 0.43 | 0.44 a | |
mm |
0.43 A | 0.44 A | 0.43 A | 0.43 A | 0.42 A | ||
| macro (cm³/cm³) | 3.86% | ||||||
Brachiaria |
0.23 Aab | 0.22 Aa | 0.18 Aa | 0.17 Aa | 0.18 Aa | ||
fodder turnip |
0.18 Ab | 0.11 Bb | 0.10 Bb | 0.16 Aa | 0.14 Aa | ||
Crotalaria |
0.28 Aa | 0.12 Bb | 0.15 Ba | 0.16 Aa | 0.10 Ba | ||
millet |
0.23 Aab | 0.10 Bb | 0.15 Ba | 0.13 Ba | 0.16 ABa | ||
scarifier |
0.23 Aab | 0.10 Bb | 0.15 Bb | 0.13 Ba | 0.16 ABa | ||
mm |
|||||||
| EN (cm³/cm³) | 2.41% | ||||||
Brachiaria |
0.64 Aa | 0.64 ab | 0.60 Aa | 0.60 Aa | 0.59 Aab | ||
fodder turnip |
0.63 Aa | 0.55 Bb | 0.53 Ba | 0.59 ABa | 0.55 Bab | ||
Crotalaria |
0.68 Aa | 0.56 Bb | 0.57 Ba | 0.59 Ba | 0.51 Cb | ||
millet |
0.69 Aa | 0.53 BCb | 0.59 Ba | 0.55 Ba | 0.59 Bab | ||
scarifier |
0.65 Aa | 0.58 Bab | 0.59 Ba | 0.56 Ba | 0.59 Bab | ||
mm |
|
|
|
|
|
||
Note: *mm= marginal means when there is no interaction between treatments. |
|||||||
The authors of (Gal, et al. 2007; D’Haene, et al. 2008) found that the effects of soil management and its cover are limited to a depth of 20 cm. However, the results of this work showed a reduction of 3.3% of the forage radish in the preparation with a scarifier and 12.5% of the brachiaria in the preparation with a harrow in the layer below the depth of 0.20 m. Mechanical interventions, such as subsoiling or scarification, are not always efficient to mitigate soil compaction, as they usually have a temporary effect, which requires frequent repetitions (Tim Chamen, et al. 2014). However, cover crops are a good alternative for decompacting the soil, obtaining good results in the physical attributes of the soil (Severiano, et al. 2010; Jimenez, et al. 2008). Cover crops have advantages over mechanized management systems as they promote the breakdown of soil structures while cover crops favor the production of root exudates, that are agents of aggregation of soil particles and also improves porosity at the expense of root growth (Rosa, 2013).
In general, the cover crops brachiaria, forage radish, crotalaria and millet provided improvements in the physical attributes of the soil in relation to the conditions prior to its implementation. There was a decrease in RMSP in all treatments after growing cover crops within the different soil preparations. In general, the forage radish was the species that most stood out in the positive results of improvement for the physical attributes of the soil.
[Crossref] [Google Scholar] [Pubmed]
[Crossref] [Google Scholar] [Pubmed]
[Crossref] [Google Scholar] [Pubmed]
Select your language of interest to view the total content in your interested language