
Review Article - (2022) Volume 12, Issue 4
Received: 25-Oct-2022, Manuscript No. IJMSA-22-77185; Editor assigned: 28-Oct-2022, Pre QC No. IJMSA-22-77185 (PQ); Reviewed: 15-Nov-2022, QC No. IJMSA-22-77185; Revised: 22-Nov-2022, Manuscript No. IJMSA-22-77185 (R); Published: 01-Dec-2022
Since its arrival in the 1930’s to North America, Dutch elm disease has devastated the population of the majestic, wide canopy, habitat-forming, shade-producing, and cooling American elm trees. Inoculation and removal of diseased trees can retard the spread. A popular choice of local governments for parkway trees since the early 1900’s, governments have the responsibility for this maintenance. In this case study of Oak Park, Illinois, we examine the deforestation of a significant part of the village. Such unfortunate occurrences create a source of global warming, both by the loss of the direct cooling effect of the shade trees as well as reducing the absorption during photosynthesis of the most significant greenhouse gas, carbon dioxide. Devastation of trees also removes their beauty from our landscapes and the loss of food and habitat for insects, birds, and mammals. Suggestions for improving the accountability of local governments in this maintenance are presented.
Older adults, health education, health promotion, effective, intervention
Man is the greatest enemy of the environment of the Earth and its inhabitants in geological history (Weisman, 2008). We view with alarm global warming, deforestation, ocean pollution, the multiple oceanic garbage patches, “pest control” specialists spreading toxic poisons in your home and on your landscaping, the use of toxic artificial turf (Golden, 2021), the application of poisons in the name of green lawns, mining and forestry in old growth forests, the annihilation of Canadian pup seals, the massacres of wolves by American “sportsmen,” lack of compassion for native fauna (Moe, 1946), inhumane factory farms (Baur, 2008; Bekoff, 2008), the road to extinction of most African wildlife, including orangutans, chimpanzees, lions, rhinoceroses, and elephants for “bush meat,” horns, and tusks, the horrors of thoroughbred horse racing and the Iditarod, manatee deaths by motorboat propellers, bird deaths resulting from collisions with glass windows of high-rise buildings, the killing of animals for their fur, ignorant local statues defining pit bulls as vicious and dangerous dogs, the existence of puppy mills, the ghastly torture of beagles, monkeys, mice, and rats for pharmaceutical research, the lifetime incarceration of animals in zoos rather than free-roaming preserves, the dragging of huge bottom trawling nets, equivalent to bulldozing the ocean floor, which destroys marine habitats and kills hundreds of millions of fish annually (Siad et al., 2022), and the horrific beatings and torture sustained by orangutans and chimpanzees by Hollywood trainers for the movies. This includes the poor orangutan Buddha, of clint eastwood’s any which way you can fame. In this paper we demonstrate how government neglect and inefficiency leads to the destruction of urban forests.
Environmental consequences of the loss of old growth trees
The decrease in the number of trees in urban forests presents severe environmental effects including enhanced global warming. Trees not only are natural refrigerators of their proximate environment by shading but also during photosynthesis absorb carbon dioxide, a significant greenhouse gas responsible for a major portion of the terrestrial greenhouse effect (Bordelon, Urban Forestry). Trees purify the air by removing sulfur dioxide (SO2), ozone (O3), nitrous oxide (N2O), and smoke particulates, in particular those generated by diesel engines. Along with water vapor, methane (CH4), chlorofluorocarbon-12 (CCl2F2), and hydrofluorocarbon-23 (CHF3), three of these substances filtered out of the air by trees, namely carbon dioxide, ozone, and nitrous oxide, are primary greenhouse gases (NASA, 2007; Center for Climate and Energy Solutions). They also provide food and habitat for insects, birds, and mammals. Replacement of natural grass areas by artificial grass often entails destruction of trees; including entire stands of old growth trees (Golden, 2021).
The loss of 29% of the bird population in North America between 1970 and 2018, amounting to 2.9 billion birds, has now been documented. A major cause identified by the Cornell Lab of Ornithology researchers is loss of habitat. (Rosenberg et al., 2019) That means trees. We call upon individuals to ask local governments to take action to prevent the continuing massacre of trees and those animals for which trees provide food and habitat.
Dutch elm disease
Since it arrived in America in the 1930’s, Dutch elm disease has devastated the American elm tree population in America. Originating in Asia, it was carried to Europe during World War I, and then migrated to America. It is caused by the fungus Ophiostoma ulmi, also known by its previous name as Ceratocystis ulmi, the disease appeared in the Chicago area in the early 1960’s at which time Dutch elm disease began its local devastation. Unlike the response of numerous other suburbs of Chicago to inoculate healthy elms, the response of Oak Park was only to remove diseased trees in hopes of preventing the migration of the fungus-carrying beetles to other American elms.
Unfortunately, in well-documented studies Dutch elm disease continues to annihilate those lofty American elms by the spread of those fungus-carrying beetles. The once glorious canopy over the streets of Oak Park no longer exists. Once infected, the life of the tree can be extended by inoculation with fungicides. On the other hand, the infection can actually be largely prevented by inoculation. Most municipalities, however, don’t value their trees and homeowners, except me, can’t rationalize the expense of preventative inoculation. If the tree is diseased, the visual evidence being flagging, a yellowing and dropping of leaves in small areas of the canopy, it should be taken down as soon as possible. If not, the disease can spread by those beetles flying to other trees or the fungus itself spreading via roots intertwining with those of adjacent trees. Barring inoculation of healthy American elms, mitigation can only be achieved by quick removal of diseased trees. This case study shows the result of failure to do so.
The forestation and deforestation of Oak Park, Illinois
In the early decades of the twentieth century, the village of Oak Park, Illinois, created an enviable urban forest on its parkways by planting rows of the grandiose American elm. By the middle of the century, one could stand in the middle of the streets and view a cathedral-like ambiance of arching branches forming a canopy by stretching over the streets from both sides, the lofty branches intermingling over the centers of the streets.
The head of buildings and grounds of the Oak Park park district during the period relevant to this study, Michael T. Grandy, was promoted from cashier at a local swimming pool. A recreation major in college, he had no expertise in tree care, or, for that matter, other flora.
A tree was diagnosed as having Dutch elm disease next to the tennis courts at the far northwest end of Greenfield Park (now renamed Lindberg Park after a government bureaucrat) in about 2005 (Figure 1). The tree was not quickly removed to prevent spread of the disease. Indeed, every single leaf was gone and the tree was entirely without life when it was finally removed. By that point only financial considerations mattered to the park district bureaucrats. The moribund, heavy limbs presented a threat to life, with the potential of legal action in case of an injury. Years had passed since the tree was seen to have Dutch elm disease.

Figure 1. The location of dead elm trees resulting from infestation from the ground zero elm tree in Greenfield Park, Oak Park, Illinois.(Note: The ground zero elm is marked by the cross sign in the upper-left hand corner of the graph. Greenfield Park includes a large portion of treeless land for tennis courts and ball fields. The north part of the first annular region is a treeless business district. Red circles represent the raw data of dead elm trees. A superimposed square grid enables determination of the areas of the circular and annular regions. By the date at which these data were provided, in 2008, the fungus-carrying beetle had not caused an enhanced death rate of the American elm trees beyond the central and four annular regions reckoned from the ground zero tree).
By that time the disease had spread. The nakedness of the parkways near the expansive Greenfield Park in the northwest part of the village was brought to our attention by the local mailman and we requested details of recent American elm tree removals from the village forester. Figure 1 shows the location of tree deaths provided by the village forester in 2008, overlaid on an area of the northwest part of Oak Park, from just south of Thomas Street north to North Avenue and from Harlem Avenue east to Linden Avenue, an area of approximately 1.15 km2. Annular regions are drawn around a central circular region in which the epicenter of death, the ground zero tree, is located. The superimposed square grid provides the means of estimating the areas of the circular and annular regions, by the brute force analysis to follow, and thus the areal density of demised trees. It was apparent that 64 additional trees in the neighborhood of Greenfield Park had succumbed to the disease.
The legacy of the head of buildings and grounds of the Oak Park park district was the complete deforestation of hundreds of acres as surely as if Amazonian loggers had invaded. Now only young saplings exist where majestic elms once provided a wondrous canopy stretching from parkway to parkway across the residential streets of shade, cooling, joy, and habitat for birds, squirrels, ground spiders, soil-producing worms, ant colonies, locust larvae, other insects, and billions of nitrogen-fixing microbes.
The Oak Park park district has a long history of cavalier attitudes toward trees and the environment. This includes volunteering their staff to destroy every tree surrounding the parking lot of an elementary school adjacent to a park because the berries would spoil the cartops, destroying dozens of old growth trees to make room for a soccer field (Noel, 2007; Pierce, 2007), and destroying old growth trees, leveling a popular interracial-utilized sled hill, and digging up acres of natural grass and killing their insect inhabitants for an artificial turf playing field (Jonas, 2013; Manchir, 2013), all under the direction of Michael T. Grandy.
Some question among arborist exists as to both the migration distance of the beetles, resulting in part from finite mating territory and availability of food, and the velocity of the spread of DED, miles of spread per year. Municipalities react by removing deceased trees but without such analysis. Because Dutch elm disease is not the only cause of deaths of American elm trees, a more robust analysis could be made based on Bayesian statistics. Such requires identification of all causes of death and the probability that all such causes result in death. Causes would include homeowner application of pesticides, over-pruning, proximity to driveways, winter salting of sidewalks, street construction, age, storm damage, and drought. Knowing that Dutch elm disease is present and is fatal to the trees in a large fraction of cases, and without detailed knowledge of the probabilities of demise resulting from these other causes, the Bayesian analysis cannot be performed.
Graphical presentation
The number of dead elm trees in the circular and annular regions is provided in the third column of Table 1. They are displayed in part a) as “raw data.” The initial impression of fewer dead elm trees in the regions closer to the ground zero tree results from the smaller areas of those regions compared to the outer three annular regions. The analysis that follows compensates for this selection effect. Part b) displays the corresponding results for the “adjusted data,” provided in the sixth column (Figure 2) (Table 1).
| Region | Area | Raw number | Theor. number | χ2 calculation | Adj. raw number | Theor. adj. number | χ2 calculation | |
|---|---|---|---|---|---|---|---|---|
| 1 | 42 | 9 | 5.756 | 1.828 | 14 | 6.296 | 9.429 | |
| 2 | 85 | 14 | 11.649 | 0.475 | 15 | 12.741 | 0.401 | |
| 3 | 100 | 12 | 13.705 | 0.212 | 12 | 14.989 | 0.596 | |
| 4 | 109 | 15 | 14.938 | 0.000 | 15 | 16.338 | 0.110 | |
| 5 | 131 | 14 | 17.953 | 0.870 | 14 | 19.636 | 1.618 | |
| Total | 467 | 64 | 64.000 | 3.386 | 70 | 70.000 | 12.153 | |
Note: The second column presents the number of squares in the overlaid grid of Figure 1 within each region, a measure of the respective areas. The raw data in the third column are those reported. The adjusted raw data in the sixth column result from augmented results in the innermost two regions, a correction to allow for treeless land in those regions. The fourth and fifth columns and the seventh and eighth columns provide the results of the χ-square test discussed in the text. |
||||||||

Figure 2. The number of dead American elm trees resulting from the ground zero tree at Greenfield Park.(Note: The raw data and the data adjusted for a significant amount of non-landscaped areas in the inner two regions are graphed in red dashed lines in part a) and part b), respectively. The black continuous lines result from the hypothesis that a uniform distribution of dead elm trees occurs over the regions. Table 1 presents the data employed in creating for these graphs, the third and fourth columns for a) and the sixth and seventh columns for b). We use these data to perform the χ-square test discussed in the text).
We see that in both cases, except for region 4 of the raw data case (a), the number of dead elm trees is greater than those based on the hypothesis of a uniform distribution for regions 1 and 2, and less than those based on this hypothesis for regions 3, 4, and 5. This indicates that a greater number of dead elm trees occurred near the ground zero tree.
We analyze these data in two ways, graphical and via a χ-square test. Table 1 presents the raw data and the results of a statistical analysis of the elm tree deaths. The second column presents the number of squares from Figure 1 in each region. The third column provides the raw data of the number of dead elm trees in each region. The sixth column provides adjusted figures for the raw data in the first two regions. The first region, the circular region, includes a large portion of the tennis courts and ball fields of Greenfield Park, where no trees are planted. The second region includes a business district where no trees are planted. The other regions include only residential streets with tree-lined parkways. For consistency, then, the values for diseased trees in the first two regions are increased by the ratio of treeless land to residential streets. The sixth column presents the resulting adjusted number of diseased trees. The fourth and fifth columns and the seventh and eighth columns provide the results of the χ-square test to be discussed below.
An examination of the second column shows that the sizes of the regions differ (Table 1). This creates a bias in the raw data. As noted above, the raw data for the innermost two regions, in particular, are biased by the smaller areas of those regions compared to the outer three annular regions.
To compensate for this, we calculate the density of dead elm trees in each region, the number divided by the number of squares in each region. The unit of density is then number of dead trees per overlaid square. The results are provided in Table 2 and graphed in Figure 3. With this analysis performed, we see that the density of dead elm trees increases within annular areas approaching the epicenter defined by the original diseased and neglected American elm tree, the “ground zero elm tree.” Indeed, the trend exists even for the raw data.
| Region | Area | Raw data | Density | Adjusted raw data | Adjusted density |
|---|---|---|---|---|---|
| 1 | 42 | 9 | 0.214 | 14 | 0.333 |
| 2 | 85 | 14 | 0.165 | 15 | 0.176 |
| 3 | 100 | 12 | 0.120 | 12 | 0.120 |
| 4 | 109 | 15 | 0.138 | 15 | 0.138 |
| 5 | 131 | 14 | 0.107 | 14 | 0.107 |
| Total | 467 | 64 | - | 70 | - |
Note: The results are calculated as the number of dead elm trees in each region divided by the corresponding number of squares in the overlaid grid in Figure 1, as given in the second column. This provides a measure of the areas of the regions. We see an enhanced death rate in the two regions near the ground zero tree for both the raw data and the adjusted raw data. |
|||||

Figure 3. To compensate for the difference in the sizes of the various regions, the density of dead elm trees in each region is calculated. (Note: These graphs of the data in Table 2 clearly demonstrate the enhanced deaths in the two inner regions, closest to the ground zero tree).
Although the relationship between the number of elm tree deaths as a function of the distant from the ground zero leafless elm tree is clear, we can quantify it by performing a χ-square test to determine the significance of this relationship.
The χ-square test
Our hypothesis states that the theoretical number of dead elm trees per unit area, xti, i=1 to 5, is the same for each of the five regions, so that the variation from region to region results solely from statistical fluctuation. Our mathematical model, then, is a uniform distribution. To test this hypothesis, we employ the χ-square test (Freund et al., 1958; Trumpler et al., 1962; Golden, 1974). In this context, as with all statistical tests of hypotheses, we refer to this as the null hypothesis. That means that no systematic effects underlie the data so that no difference exists, within random errors, between the values, in our case, for each region.
To perform this analysis we first must determine the theoretically-expected values for the number of dead elm trees in each region. From Figure 1 we see that 467 squares are located in the combined five areas. Based on the hypothesis that the distribution of dead elm trees is uniform over the area, our mathematical model, the null hypothesis, with 64 dead elm trees and 70 adjusted number of dead elm trees, the expected number of dead elm trees per square is 64/467=0.137045 and 70/467=0.149893, for the raw and adjusted data, respectively. Multiplying these expected numbers by the respective number of squares in each region then gives the theoretically-expected number per region, xti. The raw data and the corresponding theoretically-expected number are provided in the third and fourth columns of Table 1. The results for the adjusted raw data are provided in the sixth and seventh columns of Table 1 and Figure 2.
A rule of thumb that statisticians employ states that the χ-square test is applicable if none of the observed values is less than 5 and if the number of degrees of freedom, to be discussed below, is greater than about 5 (Parratt, 1971). These conditions result from an analysis of the approximations made in deriving the theoretical distribution of χ2. The results in the fourth and seventh columns of Table 1 indicate that we can accordingly proceed on the first criterion. We’ll see below that we’re a bit less secure in proceeding based on the second criterion, but we will proceed nonetheless. Comparing those values of xti to the actual number of dead elm trees observed per region, xoi, i=1 to 5, then provides the data for the χ-square test, viz.
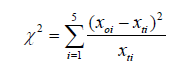
The results are shown in the fifth and eight columns of (Table 1) for the raw and adjusted raw data, respectively.
With 4 degrees of freedom based on 5 data points less the constraint that the number of actual observations equals the number of theoretical observations, as shown in the last row of Table 1, we refer to a table of the χ-square distribution (Trumpler et al., 1962). The meaningful result of χ2=12.153 shows that the null hypothesis of a uniform distribution of dead elm trees must be rejected at about the 1.5% level of significance. That means that if we did this experiment many, many times, and if in fact the distribution were uniform, that is, the null distribution were true, then we would expect the value of χ2 to equal or exceed 12.153 only about 1.5% of the time. We accordingly reject the null hypothesis and opine that this mathematical basis for that decision survives scrutiny. This rejection was clear, as noted, from Figure 2. To summarize, the number of dead elm trees per unit area was greater the closer the region to the ground zero tree of governmental neglect. We note that in some cases of the application of the χ-square test an observed distribution is compared to a model distribution that is described by a mean and standard deviation. In this case, the assumption is made that the mean and standard deviation of the model distribution are equal to those of the observed distribution. That introduces two additional constraints, thereby reducing the number of degrees of freedom by 2.
The arboreal calamity tends to make us forget the cost to the taxpayer of bureaucratic incompetence. The cost of cutting down a huge tree, and mature American elms are huge, buying and planting a new tree, and maintaining the young tree in its first seasons by watering and mulching reaches $4000 per tree. At that cost, the murder of 64 trees cost the Oak Park taxpayers $250,000. We’re not even discussing the additional dead trees that resulted from the ground zero trees subsequent to the acquisition of the data used in this case study. If that kind of performance had occurred in the private sector, the paper-pusher would be out looking for a job. Cooking fries at McDonalds might be an appropriate calling. This, however, is government, where the prime qualifications are do what you’re told, show no initiative, and don’t rock the boat. That way everyone gets to keep their lifelong job.
Governments have no vested interest in preventing the devastation of the urban forest. Indeed, tree service firms earn $1000 to $4000 for removal of diseased trees and tree nurseries earn hundreds of dollars for each sapling sold. Many municipal arborists leave government work for the higher salaries in the private sector and lobby their former employees for tree removal and tree planting contracts.
Only residents of the communities remain to mitigate the devastation. This can be done by political action at the local level. For one, communities can form tree advisory commissions whose members lobby for inoculation and rapid removal of diseased trees. A resident trained in forestry should, if available, be named to such commissions. Second, hiring of employees at park districts and municipalities in charge of buildings and grounds should require knowledge of trees and tree diseases. Again, realizing that American elms also exist on private property as well as municipal parkways, funds should be made available in a cost-sharing program with homeowners to inoculate their American elm trees. The neglect of governmental agencies to aggressively remove American elm trees afflicted with Dutch elm disease or to inoculate healthy American elm trees leads to the spread of the disease and consequent devastation of urban forests which provide a natural cooling mechanism and food source and habitat for animals.
We are grateful to James Semelka for providing the data on elm tree deaths in northwest Oak Park.
Select your language of interest to view the total content in your interested language