
Research Article - (2023) Volume 17, Issue 1
Received: 27-Nov-2023, Manuscript No. AJPS-23-121216; Editor assigned: 29-Nov-2023, Pre QC No. AJPS-23-121216 (PQ); Reviewed: 13-Dec-2023, QC No. AJPS-23-121216; Revised: 21-Dec-2023, Manuscript No. AJPS-23-121216 (R); Published: 28-Dec-2023
Bayesian Inference, a statistical method that utilizes Bayes’ Theorem, employs data to update prior beliefs about parameters. Bayesian method is characterized by its explicit use of probability to quantify uncertainty in statistical data analysis-based inferences. This paper applies Bayesian data analysis to infer the voting intensions of the Addis Ababa residents for the ruling party assuming a mid-term election is held in November 2023. By incorporating prior beliefs derived from previous election results and data from survey, the posterior probability of the ruling party’s election outcome is estimated. Subsequently, a sensitivity analysis is performed to assess the influence of prior choice of the results. Despite the polling results showing a 32% share for the ruling party, Bayesian analysis, when combined with historical information (results of the previous elections), suggests that the ruling party will secure 60% of the parliamentary seats representing Addis Ababa.
Bayesian theorem, Bayesian inference, Bayesian data analysis, sensitivity analysis, posterior distribution, Quantitative social science
Following the overthrow of the Derg regime by the Ethiopian People’s Revolutionary Democracy Front (EPRDF) in 1991, Ethiopia embarked on a new era of democratic governance with the introduction of a national election system. This system allows citizens to elect representatives to the Federal Parliament and Regional Councils. Addis Ababa, the capital city, holds a significant presence in the Federal Parliament, occupying 23 out of a total of 547 seats (National Board of Election of Ethiopia).
Since the inception of this new electoral system, Ethiopia has conducted six national elections (Lyons. 2010). With the exception of the 2005 election, these elections have been characterized by a lack of genuine competition, with the ruling party, the EPRDF and its successor, the Prosperity Party (PP), consistently securing landslide victories. The 2005 election stands as an anomaly, as opposition parties managed to sweep all 23 seats representing the capital city. This outcome marked a significant shift in the political landscape of Ethiopia. The 2005 election, though a departure from the norm, highlights the potential for political change in Ethiopia. While the EPRDF and then PP has maintained its grip on power, the emergence of a viable opposition indicates a growing demand for democratic representation and accountability (Lyons. 2010).
This paper analyzes the results of a mid-term poll in Addis Ababa, assuming it will be held in November 2023. The analysis is preceded by a brief overview of quantitative analysis in social science, particularly in political science, in Section 2. Section 3 then provides a concise introduction to Bayesian data analysis. The subsequent sections delve into the analysis of the polling results in Addis Ababa.
Quantitative analysis in understanding social phenomena
Quantitative analysis and bayesian inference: Quantitative analysis plays a crucial role in social science, particularly in political science, by providing a systematic and rigorous approach to understanding and explaining political phenomena. It employs statistical methods and techniques to analyze large datasets, identify patterns and trends, and draw inferences about political behavior and outcomes. A powerful tool within quantitative analysis is Bayesian inference, which utilizes Bayes’ theorem to update prior beliefs about parameters (random variables) in light of new data, arriving at what is termed “posterior belief.” Simply put, Bayesian inference allows us to learn about parameters from data (acquired knowledge) in a manner consistent with the laws of probability.
Combining quantitative analysis with Bayesian inference provides a powerful framework for understanding and predicting political phenomena. By incorporating prior beliefs and updating them based on empirical evidence, Bayesian inference allows for more nuanced and informed interpretations of political data. This approach is particularly useful in situations where data is limited or uncertain, as it enables researchers to make informed inferences based on both data and prior knowledge.
In the context of political science, Bayesian inference can be used to analyze a wide range of phenomena, including:
Election forecasting: Analyzing polling data to predict election outcomes
Public opinion analysis: Understanding public attitudes towards political issues
Political behavior modeling: Identifying factors that influence political participation and decision-making
Policy evaluation: Assessing the impact of government policies on social and economic outcomes
Overall, quantitative analysis and Bayesian inference are essential tools for understanding and explaining political phenomena. By providing a systematic and rigorous approach to data analysis, these methods enable researchers to make informed inferences about political behavior and outcomes, contributing to a deeper understanding of the political world.
Data analysis in social science
Data analysis in social science employs probability models to connect observed datay =(y1, .. ..yn)' to unknown parameters θ. The likelihood function, defined as any function of θ proportional to the probability density function of the observed data given θ, denoted as f(y/θ), summarizes the information about θ iny. It is defined as
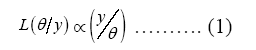
There are two main paradigms or approaches in statistics: Frequentist and Bayesian [2,4,6]. Both approaches utilize the likelihood function for statistical inference. Frequentist inference treats θ as fixed but unknown. Sample-based estimates of θ, denoted by θ^, are treated as random (since repeated sampling, could yield different values of θ^). The most widely used estimate of θ is the maximum likelihood estimate, which is that value of θ that maximizes Equation 1.
Bayesian inference, on the other hand, treats θ^ as fixed (a feature of the observed data y) and θ as random, reflecting our uncertainty of its true value. Here probability is used to characterize this uncertainty and produce probability statements about θ give y. The likelihood function summarizes the sample information about θ and provides an essential input for Bayesian data analysis.
Starting from the 1990’s there was a surge of interest in Bayesian data analysis within the statistics profession. This trend has since extended to quantitative social science. The mathematical computations involved in Bayesian data analysis have been significantly simplified through a suit of algorithms known collectively as Markov Chain Monte Carlo (MCMC) methods. The combination of MCMC and the rising computation power available means that Bayesian analysis is now an integral part of the mainstream of quantitative social science.
Numerous papers have been published that demonstrate the application of Bayesian data analysis in social science, particularly in political science. For instance in (Luque C. et al, 2023) the authors implement a multinominal-Dirchlet model to analyze the 2022 Colombian presidential consultations (Lyons.,2010). This model allows them to estimate the population share of votes that each candidate will receive based on data provided by a national pollster. Their result closely matches the observed data for all but one candidate, whom they attribute to unexpected political changes prior to the Election Day.
The same authors also showcase the use of Bayesian data analysis in a biological study, examining the reproductive activities of 52 female sparrows during the summer. They investigate the relationship between the number of offspring and age of sparrows using a Poisson regression model. While this is a typical application in biostatistics, they highlight its relevance to social science due to its connection to reproductive patterns and population dynamics. They successfully illustrated the use of the Metropolis-Hastings algorithm along with the Hamilitonian Monte Carlo algorithm for obtaining samples from the posterior distribution.
The authors in studied the voting intentions (Jackman S., 2004) Florida for the November 2002 U.S. presidential election. They utilized the polling result conducted by Mason-Dixon Polling and Research Center in March 2000 as the observed data. They then constructed their prior belief using a simple regression model based on previous presidential election outcomes from 1932 to 1996. By combining the information from the prior and the survey using Bayes’ theorem, they conclude that they are reasonably confident that Bush would defeat Gore. They also demonstrated that the posterior density has less dispersion (more precision) than the prior or the survey result alone.
These examples and other works as in (Hendrie et al, 2009) illustrate the versatility and effectiveness of Bayesian data analysis in social science research. Its ability to incorporate prior beliefs, update them with new evidence, and make probabilistic statements about unknown parameters makes it a powerful tool for understanding and predicting social phenomena.
Bayes’ theorem
Bayes’ Theorem, also known as Bayes’ rule, is one of the most important results in statistics. In its simplest form, if H is a hypothesis and E is evident, i.e. data, then Bayes’ Theorem is given by:
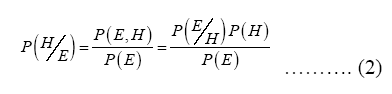
Where P(H) and P(E) are the a priori probabilities of the events H and E respectively; P(E,H) is the joint probability of the two events, and P(H/E) and P(E/H) are the conditional probabilities of H(or E) given E(or H). P(H/E) is usually referred to as the posterior probability of H. The theorem thus gives a solution to the general problem of inference, providing a mechanism for learning about a hypothesis from data.
In most analysis in social science, the interest is to learn about a continuous parameter rather than discrete parameters considered in Equation (2). As previously, we refer to a generic parameter as θ and denote the data available for analysis as y =(y1, .. ..yn)'. Here beliefs over the parameter are represented as probability density functions. Generically, we denote the prior probability function as p(θ) and the posterior as p(θ/y). Thus Bayes’ Theorem for a continuous parameter is given by:
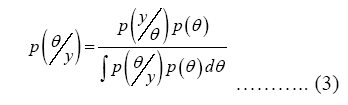
And is more commonly expressed as:
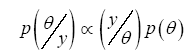
Where (y/θ) is the likelihood function. In words, Equation 3 states that “the posterior is proportional to the prior times the likelihood function” (Jackman S., 2004).Thus the likelihood function can be turned into a probability statement about θ, given data y.
To add some notes about Equation (3); the Bayesian approach treats the parameter θ as a random variable and makes inference conditional on the data. If the prior for θ is uniform (i.e., p(θ)=c>0, c is constant) or any value of θ is equally likely as any other, a priori, then the posterior is simply proportional to the likelihood. This is because the uniform prior is absorbed into the constant of proportionality in Equation (3). This means that when prior beliefs about parameters are uniform, reflecting “prior ignorance” about θ, then the results of both the Bayesian analysis and likelihood based analysis coincide [1-4].
Mid-term polling results analysis in Addis Ababa
Ethiopia conducts national and regional parliamentary elections every five years. The first election was held in May 1995, and six elections have been held since then (Teaching Material in Statistical Machine Learning.,). The most recent election was held in June 2021, delayed by a year due to the COVID-19 pandemic (National Board of Election of Ethiopia).. The next election is scheduled to take place in May 2026.
This paper is not about the election results of 2026, rather it analyzes the voting intentions of Addis Ababa residents in an assumed mid-term election held in November 2023. For this purpose, a poll of 103 residents was conducted to assess the potential vote share of the ruling party and other political groups. The pool results indicate that the ruling party’s vote share in Addis Ababa stands at 30.1%. The other parties and individual candidates collectively hold a share of 63.1%, while 6.8% of the respondents remain undecided. These findings highlight the potential for a significant shift in voter preferences in Addis Ababa. The ruling party’s dominance in previous elections appears to be waning, with a substantial proportion of voters indicating their intention to support other political options.
For the sake of simplicity, the undecided share is ignored, leading to the ruling party’s share being 32%, with a standard error of 0.048 and a sample size of n=96 respondents expressing their preferences. Despite the data being binomial, with this relatively large sample size, the use of normal distribution is justified due to the relatively large sample size, providing a good approximation to the sampling distribution. The mean is calculated as 0.32, with a standard deviation of 0.048. Consequently, based on this poll, the indication is that the ruling party is trailing in the upcoming November 2023 mid-term election.
Now, the critical question arises: How realistic is the outcome of this poll result? Can we leverage other available information that may shed light on the election result. Notably, previous election results in Addis Ababa can serve as a valuable source of information, which are exploited here by a simple regression model. Examining the outcomes of the six election results in Addis Ababa reveals a consistent trend, with the ruling party securing the majority of seats in all instances, except for the 2005 election. During that particular election, the opposition party claimed victory by winning all 23 seats that represent Addis Ababa in the Federal Parliament.
A regression model, incorporating dummy variables for each year, was utilized to analyze historical election results spanning from 1995 to 2021. Consistent with the survey results analysis, the dependent variable was the ruling party’s share. Subsequently, the regression model was applied to forecast the outcome of the impending mid-term election scheduled for November 2023, under the assumption of parliamentary seat representation for Addis Ababa. The results indicate a projected share of 91%, with a standard error of 5.0 percentage points.
Bayes’ theorem was employed to integrate information derived from previous elections with data obtained from the survey. The prediction from the previous elections’ regression analysis is treated as a prior, and the survey data serve as evidence. In applying Bayes’ theorem, the assumption is made that the information provided by the previous elections’ regression analysis can be represented as a normal distribution, with a mean equal to the point prediction (91%) and a standard deviation equal to the standard error of the point prediction (5.0 percentage points). This representation is considered the prior density for the problem.
Similarly, the information obtained from the survey is summarized with a normal distribution, characterized by a mean of 32% and a standard deviation of 4.8 percentage points. Consequently, both the prior and likelihood for this problem are modeled as normal distributions. This implies that the posterior density, representing the updated belief after incorporating the survey data, will also take the form of a normal distribution (Gelman A., 2020). In general, when the posterior density shares the same functional form as the prior density, the prior is described as “conjugate” to the likelihood.
Given a normal prior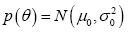 and a normal likelihood
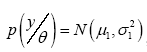 with
with known, the posterior density is
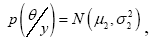 where (Gelman A., 2020)
And
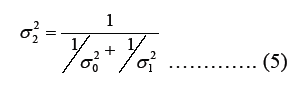
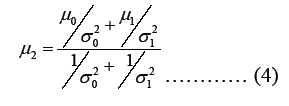
The outcome of this conjugate normal/normal problem can be interpreted as follows: “The posterior mean represents a weighted average of the prior mean and the maximum likelihood estimate, with the weights determined by the precision of each. The precision of each distribution corresponds to the inverse of the respective variance. Therefore, the posterior distribution is a balanced synthesis of the prior information and the observed data, where the precision (inverse variance) serves as a guide for determining the weight assigned to each component.
The result is applied to the problem with μ0=0.91, μ1=0.32, σ2 = 0.0025 and σ2 = 0.0023. Hence, the posterior over the ruling party’s vote share in Addis Ababa is normal distribution with mean
μ2=0.60 and standard deviation of σ2 = 0.035. This meansthat the posterior 95% confidence interval ranges from 53.07% to 66.68%, with almost all of the posterior probability lying above 50%. That is the probability that the ruling party will have a majority representation of Addis Ababa in the parliament is almost certain (99%). Figure 1 below provides a graphical depiction of the Bayesian analysis. As can be seen from the graph, the posterior mean lies between the prior and the survey result. It can also be seen from the analysis and the graph that the posterior has more precision (less dispersion) than both the prior or the survey result alone.

Figure 1. Bayesian Analysis of the Ruling Party Support in Addis Ababa
In contrast to the signal observed in the survey data, the ultimate outcome reveals a significant influence of the prior. What happens if we weaken or strengthen the prior This is discussed in the sensitivity analysis presented in the next section.
Sensitivity analysis
The primary critique of the Bayesian approach centers on the perceived subjectivity inherent in the specification of the prior distribution. From a frequentist standpoint, conducting data analysis based on subjective information is criticized for lacking scientific rigor. Nevertheless, the question arises: Why disregard accessible external information that aligns with reality when it can enhance the understanding of the phenomenon under investigation, leading to more precise inferences and plausible conclusions (Luque C. et al, 2023).
Diverse individuals may harbor varying prior beliefs regarding the level of support for the ruling party’s vote. For instance, some may question the relevance of previous election data. Consequently, in Bayesian data analysis, it becomes imperative to conduct a sensitivity analysis. This ensures that the drawn conclusions could be replicated by another individual with similar (though not necessarily identical) prior beliefs.
There are two approaches to conducting a sensitivity analysis: The first involves adjusting the strength of the adopted prior, and the second entails repeating the analysis with different priors. In our presented problem, this paper opts for the first type of sensitivity analysis. Here, the adjustment of the prior’s influence is achieved by multiplying the prior standard deviation by a scale parameter k≥ 0.
When
k=0 it results in a spike-like (impulse) distribution, rendering the random variable θ a constant. The prior distribution will exhibit zero variance, signifying infinite precision, providing no capacity for data influence.
For k>1 a less precise version of the prior is generated, with successively larger values of k producing progressively weaker or uninformative priors. Consequently, the resulting posterior densities become successively dominated by the survey data. As k → ∞, the prior transforms into a uniformly distributed state, and the data entirely supersedes the prior. A uniform prior is flat across the parameter space region supporting the likelihood. In this scenario, the Bayesian analysis aligns with conclusions derived from an analysis solely based on the likelihood.
Applying the type of sensitivity analysis chosen yields the posterior mean and probability distribution depicted in Figures 2 (a) and (b) below.

Figure 2. (A) Sensitivity Analysis Showing the Posterior Mean (Blue line) as a function of the sensitivity parameter, k. The lower and upper lines are the 2.5% and 97.5% quintiles of the posterior respectively. (B) The Posterior probability the Ruling Party’s vote share exceeds the 50% mark (Majority share) as a function of the sensitivity parameter, k. Horizontal line is at 0.5 and the vertical lines are at k=1 and 1.5.
Figure 2(a) represents the location of the posterior mean as a function of the sensitivity parameter k. As can be seen as k → 0, the posterior tends towards a distribution that is degenerate with point mass equal to the prior mean. On the other hand, as k k→ ∞, the posterior becomes the normal distribution implied by the survey data. Figure 2(b) shows the posterior probability that the ruling party’s vote share is greater than the other candidates considered collectively. With k<1, this probability is greater than 99% and only with a substantial weaker version of the prio(k>1.5) does the probability that the ruling party’s share drops below 0.5. Hence it can be deduced that the ruling party’s share exceeds the other candidates is robust over a wide range of priors. We require that the prior’s density should be broadened by more 50% than the one we specified to find the balance of evidence pointing the other way.
In this paper, an attempt has been made to infer the outcome of an assumed mid-term election for the representation of Addis Ababa in the national parliament using the Bayesian data analysis method. By utilizing previous election results as a prior, a survey was conducted to update the information contained in the prior. Despite the two extreme results found in the prior and the survey data, the deduction was made that the currently ruling party is projected to secure 60% of the voting shares in Addis Ababa. Based on the conducted work and the obtained result, the following suggestions and recommendations are put forth:
During the survey, minimal effort was directed towards comprehending the underlying causes of the results. It was observed that over 90% of participants cited deteriorating economic conditions and a lack of good governance as reasons for not supporting the ruling party. From this observation, the following suggestions are made.
The ruling party should address economic instability and governance issues in the city to enhance its chances of securing the majority vote of the city dwellers before the actual election takes place in two and a half years.
Opposition parties are advised to formulate sound policies and strategies to gain additional voter support in the upcoming election.
The academic community is encouraged to conduct qualitative and/or quantitative research to further explore the root causes of participant dissatisfaction revealed in the survey.
This research focuses on a single parameter representing Addis Ababa. It is recommended that a comprehensive study be undertaken, considering all constituents of Ethiopia, employing more robust Markov Chain Monte Carlo (MCMC) algorithms.
[Cross ref] [Google scholar] [Pub med].
[Crossref] [Google Scholar].
[Cross ref] [Google scholar].
Select your language of interest to view the total content in your interested language