 ...the monthly, Open Access Publisher.
...the monthly, Open Access Publisher.
...the monthly, Open Access Publisher.

Research Article - (127) Volume 14, Issue 1
Received: 05-Aug-2026, Manuscript No. AJWCS-26-193373; Editor assigned: 07-Aug-2026, Pre QC No. AJWCS-26-193373 (PQ); Reviewed: 21-Aug-2026, QC No. AJWCS-26-193373; Revised: 07-Sep-2026, Manuscript No. AJWCS-26-193373 (R); Published: 14-Sep-2026
Land Use and Land Cover (LULC) change is a major driver of landscape transformation, influencing ecosystem integrity, hydrological processes, and watershed sustainability. This study assessed three decades of LULC change (1994–2025) and predicted future landscape dynamics (2035–2055) in the Morogoro river subcatchment, Tanzania. Multi-temporal Landsat imagery (1994, 2005, 2016, and 2025) was classified using the Random Forest algorithm in a GIS environment, while future LULC scenarios were simulated using a Cellular Automata–Markov (CA–Markov) model. Classification accuracy ranged from 81.15% to 86.87%, with Kappa coefficients between 0.76 and 0.83, and the CA–Markov model achieved a validation Kappa of 0.83, indicating reliable predictive performance. Between 1994 and 2025, built-up land expanded by 322.65% (499–2,111 ha) and cultivated land by 171.95% (626–1,701 ha), whereas forest, woodland, shrubland, wetlands, and open water declined by 41.51%, 77.86%, 66.03%, 74.09%, and 89.07%, respectively. Transition analysis showed that agricultural expansion and urban growth were the principal pathways driving the conversion of forests, woodlands, and riparian vegetation into cultivated and built-up land. Under a business-as-usual scenario, the model projects continued declines in forest (53.63%) and woodland (36.66%) by 2055, alongside further agricultural expansion and near-complete loss of wetlands. These findings highlight increasing anthropogenic pressure on the Morogoro river subcatchment and underscore the need for integrated land-use planning, ecosystem restoration, and strengthened conservation measures to safeguard watershed functions and long-term environmental sustainability.
Land use, LULC change, GIS and remote sensing, Change detection, CA-Markov analysis
The Land use and land cover (LULC) change is recognized as one of the most significant drivers of environmental change, influencing ecosystem functioning, hydrological processes, and the provision of ecosystem services at local, regional, and global scales (Foley et al., 2005; Turner et al., 2007). Rapid expansion of agriculture, urbanization, infrastructure development, and deforestation have accelerated landscape transformation worldwide, particularly in developing countries where increasing population pressure and economic development continue to intensify demand for land resources. These transformations alter natural ecosystem processes by modifying vegetation cover, soil properties, infiltration capacity, evapotranspiration, and surface runoff, ultimately affecting watershed functioning and environmental sustainability.
Across Sub-Saharan Africa, landscape transformation has accelerated during the past several decades as a result of rapid population growth, agricultural expansion, urbanization, and increasing dependence on natural resources for livelihoods. These changes have contributed to widespread deforestation,wetland degradation, biodiversity loss, and declining ecosystem services, particularly within river catchments that support agriculture, domestic water supply, and industrial development. In Tanzania, similar trends have been documented in several river basins where forests, wetlands, and rangelands continue to be converted into cultivated land and built-up areas (Msofe et al., 2019; Doggart et al., 2020; Ngondo et al., 2022). These landscape transformations have also raised concerns regarding the sustainability of catchment ecosystem services under increasing climate and anthropogenic pressures.
The Morogoro river subcatchment, located within the Wami–Ruvu Basin of Eastern Tanzania, is one of the country's ecologically and socio-economically important watersheds. The catchment supplies water for domestic consumption, agriculture, industry, and ecosystem functioning while supporting the rapidly growing Morogoro municipality and surrounding rural communities. However, the catchment has experienced considerable landscape transformation over recent decades, driven primarily by agricultural expansion, deforestation, settlement growth, and increasing demand for natural resources. These changes have reduced natural vegetation cover, increased pressure on ecologically sensitive areas, and raised concerns regarding the long-term sustainability of ecosystem services and watershed functions.
Previous studies in Tanzania and elsewhere have documented either historical LULC changes or environmental degradation within river catchments. However, relatively few studies have integrated long-term satellite-based change detection with future land-use prediction to provide a comprehensive understanding of both historical landscape dynamics and likely future trajectories. Within the Morogoro river subcatchment, existing studies have largely focused on general environmental degradation or water resource challenges without explicitly quantifying long-term land-cover transitions, persistence patterns, and future landscape scenarios. This knowledge gap limits the ability of policymakers and catchment managers to anticipate future environmental changes and prioritize conservation and restoration interventions in areas most vulnerable to degradation.
This study addresses this gap by integrating multi-temporal Landsat imagery, Random Forest image classification, Geographic Information Systems, and Cellular Automata–Markov (CA–Markov) modelling to assess historical and future LULC dynamics in the Morogoro river subcatchment. Specifically, the study
• Quantified spatio-temporal land use and land coverchanges between 1994 and 2025,
• (ii) Identified major land-cover transition pathways andtheir associated drivers, and
• (iii) Predicted future landscape dynamics for the period2035–2055 under existing land-use trends.
By combining historical change detection with spatial prediction, this study provides a comprehensive assessment of landscape transformation and generates evidence to support sustainable land-use planning, ecosystem restoration, and integrated watershed management within the Wami–Ruvu Basin.
Description of the study area
Geographically, the Morogoro river subcatchment (Figure 1) lies approximately between latitudes 6°20′S and 6°50′S and longitudes 38°00′E and 38°30′E, originating from the Uluguru mountains with an elevation ranging from 500 m to 2,300 m.a.s.l. (Ludovic, 2012) and flowing through Morogoro municipality into downstream lowland areas. The climate in the Uluguru mountains is bimodal, with short rains occurring from October to December and long rains from March to May, peaking in December and April, respectively. The climate of the area is typical of a sub-humid tropical type (Mahuha, 1998). The mean annual rainfall and temperature vary with altitude, with mean annual rainfall ranging from 900 mm to 2,300 mm between 500 mm and 1,500 m.a.s.l. respectively. The mean monthly minimum temperature at 500 m.a.s.l. ranges from 10°C to 18°C, while the maximum temperature ranges between 22°C and 33°C (Ludovic, 2012).
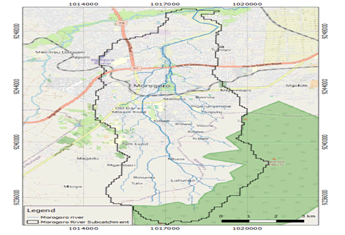
Figure 1. Map of the study area.
Land use and land cover analysis
Satellite image acquisition: Multi-temporal Landsat satellite images for the years 1994, 2005, 2016, and 2025 were acquired from the United States Geological Survey Earth Explorer platform. Landsat imagery was selected due to its long-term historical archive, moderate spatial resolution (30 m), and proven applicability in monitoring Land Use and Land Cover (LULC) dynamics over time (Wulder et al., 2019). Dry season imagery was preferred because it minimizes atmospheric disturbances, reduces cloud contamination, and improves the discrimination of land-cover classes due to lower vegetation moisture content and clearer surface visibility (Jensen, 2015).
Image processing and classification: Image processing and analysis were conducted using QGIS software. High-resolution Google Earth imagery, expert knowledge, and ground-truthing data were used to support visual interpretation and guide the selection of representative training samples. Supervised classification of LULC was carried out using the Random Forest (RF) algorithm (Belgiu and Dr, 2016), implemented through the Dzetsaka classification tool (Karasiak, 2016) in QGIS. During supervised classification, a maximum of eight distinct land cover classes were identified: Forest, woodland, riverine forest, shrubland, wetland, open water, agriculture, and built-up land. Table 1 provides the description of each land use and land cover category identified and mapped in the Morogoro river subcatchment.
| Land cover | Description |
| Forest | Land covered with naturally regenerated native tree species with canopy cover >40% |
| Woodland | Area of land covered by low-density trees forming open habitat with plenty of sunlight and limited shade, with canopy cover <40% |
| Riverine forest | A forest ecosystem found along rivers, streams, and floodplains where water availability is relatively high throughout the year |
| Shrubland | A vegetation type characterized by low, woody plants (shrubs) and scattered bushes with limited tree cover |
| Wetland | Land area that is saturated with water, either permanently or seasonally, with waterlogged soils and vegetation adapted to saturated conditions |
| Open water | Area within a body of land, of variable size, permanently filled with water, including rivers and dams |
| Agriculture | Land comprising areas actively managed for the production of crops, including both rain-fed and irrigated farming systems |
| Built-up land | Man-made infrastructure (roads and buildings) and settlements (cities and villages) |
Table 1. Land use and land cover classification scheme.
Accuracy assessment: Accuracy assessment was conducted to evaluate the reliability of the classified LULC maps using validation points derived from field observations and high-resolution satellite imagery. A confusion matrix was generated to compute overall accuracy, producer's accuracy, user's accuracy, and the Kappa coefficient. Classified maps with overall accuracy above 85% and acceptable Kappa statistics were considered reliable for further analysis (Congalton, 1991; Foody, 2002; Olofsson et al., 2014).
Change detection analysis: Change detection analysis involves determining the type, extent, rate, and location of changes in land use between different time epochs, using approaches described in the literature (Singh, 1989; Jensen, 1996; ERDAS, 1999). The study used post-classification comparison to assess land-use and land-cover changes. This approach identifies changes by comparing independently classified multi-date images pixel by pixel using a change-detection matrix (Kashaigili et al., 2006). Post-classification comparison was conducted using cross-classification analysis with the semi-automatic classification plugin in QGIS (Congedo, 2013, 2016, 2021). The rate of change for the different land cover classes was computed based on Kashaigili and Majaliwa (2010), and the Kappa coefficient was used to assess the accuracy of the final classified images.
Cellular Automata–Markov (CA–Markov) modelling for future land use and land cover prediction
The Cellular Automata–Markov (CA–Markov) modelling approach was employed to simulate and predict future Land Use and Land Cover (LULC) dynamics in the Morogoro river subcatchment. The CA–Markov model combines the strengths of the Markov chain and Cellular Automata (CA) techniques to predict both the quantity and spatial distribution of future land cover changes (Abdallah et al., 2014). The Markov chain component estimates the probability of transitions between different LULC classes based on historical land cover changes, whereas the Cellular Automata component incorporates neighbourhood interactions and spatial contiguity to allocate projected changes in geographically realistic locations.
Historical LULC maps for the periods 1994–2005, 2005–2016, and 2016–2025 were used as model inputs to generate transition probability matrices and transition area matrices. The transition probability matrix quantified the likelihood of each land cover class changing to another over time, while the transition area matrix estimated the expected extent of change for each transition category. These matrices formed the basis for predicting future land cover dynamics under the assumption that historical transition patterns would continue throughout the simulation period.
Model calibration was undertaken using the historical LULC datasets, and model performance was evaluated by simulating the 2025 LULC map and comparing it with the independently classified 2025 reference map. The agreement between the simulated and observed LULC maps was assessed using the Kappa coefficient, which measures the degree of agreement beyond chance. A high Kappa value indicates good model performance and reliable prediction of future land cover patterns. The transition probability was estimated as:

Where, Pij is the probability of transition from land cover class i to class j; nij is the number of pixels changing from class i to class j during the observation period; and m is the total number of land cover classes.
Following successful validation, the calibrated CA–Markov model was used to project LULC scenarios for the years 2035, 2045, and 2055. In addition to the transition probability matrices, the simulation incorporated land suitability maps and neighbourhood transition rules to constrain and guide the spatial allocation of future land cover changes. These projected LULC scenarios provide a basis for assessing the potential implications of future landscape transformation on water quality in the Morogoro river subcatchment and support evidence-based land use planning and watershed management.
Land use and land cover change assessment
Model performance assessment: The Land Use and Land Cover (LULC) classification produced consistently high levels of accuracy for all mapping years. Overall classification accuracies ranged from 81% to 86%, while the corresponding Kappa coefficients varied between 0.76 and 0.83 (Table 2). These values indicate a strong level of agreement between the classified LULC maps and the reference data, confirming that the resulting maps accurately represent the spatial distribution of land cover classes within the Morogoro river subcatchment.
Although slight variations in classification accuracy were observed among different years, these differences are expected due to variations in image acquisition dates, seasonal vegetation conditions, atmospheric effects, and spectral similarities among certain land cover classes, particularly woodland, shrubland, and agricultural land. Nevertheless, all classified maps exceeded the minimum accuracy threshold recommended for land-use change studies, indicating that they provide reliable information for temporal change analysis.
|
1994 |
2005 |
2016 |
2025 |
|
|
Overall accuracy (%) |
83.82 |
81.15 |
84.46 |
86.87 |
|
Kappa statistic |
0.78 |
0.76 |
0.82 |
0.83 |
Table 2. Classification accuracy and Kappa statistics by year.
The Cellular Automata–Markov (CA–Markov) model also demonstrated strong predictive performance in simulating future land use and land cover dynamics. Model validation was conducted by comparing the predicted LULC map with the independently classified reference map, resulting in a Kappa coefficient of 0.83 (Figure 2). This value exceeds the commonly accepted threshold of 0.70 for satisfactory model performance (Pontius and Millones, 2011), indicating a high level of agreement between the simulated and observed land cover distributions. The validation results demonstrate that the model successfully reproduced both the spatial distribution and the magnitude of historical land cover changes within the catchment.
The satisfactory performance of the CA–Markov model suggests that the transition probability matrices and neighbourhood rules effectively captured the dominant land transformation processes occurring in the study area. Consequently, the model is considered suitable for projecting future LULC scenarios under the assumption that historical land transition patterns and driving forces remain relatively constant over time. The predicted land cover scenarios therefore provide a credible basis for assessing the potential implications of future landscape changes on watershed hydrology, ecosystem functioning, and water quality. Furthermore, the validated model offers valuable decision-support information for land-use planning and catchment management by identifying areas likely to experience significant land cover transformations if current development trends continue.
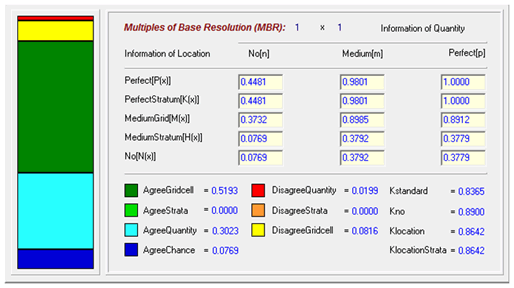
Figure 2. CA-Markov model validation.
Spatial distribution of LULC cover changes: The analysis of Land Use and Land Cover (LULC) dynamics revealed substantial changes in the spatial distribution, composition, and extent of major land cover classes within the Morogoro river subcatchment between 1994 and 2025 (Table 3). The observed patterns indicate a progressive transformation of natural ecosystems into human-dominated landscapes, characterized primarily by the expansion of cultivated land and built-up areas. These changes reflect increasing anthropogenic pressure within the catchment, driven by land conversion for agricultural production, settlement expansion, and associated socio-economic activities. The decline of natural vegetation cover over the study period highlights ongoing landscape modification, with potential implications for ecosystem functions, hydrological processes, biodiversity conservation, and the provision of ecosystem services.
| LULC | 1994 (ha) | 1994 (%) | 2005 (ha) | 2005 (%) | 2016 (ha) | 2016 (%) | 2025 (ha) | 2025 (%) |
| Forest | 1,513 | 23.84 | 930 | 14.66 | 966 | 15.22 | 885 | 13.95 |
| Woodland | 1,429 | 22.53 | 916 | 14.43 | 479 | 7.55 | 316 | 4.99 |
| Riverine forest | 1,149 | 18.11 | 1,105 | 17.42 | 974 | 15.35 | 1,002 | 15.78 |
| Shrubland | 884 | 13.94 | 628 | 9.9 | 263 | 4.15 | 300 | 4.73 |
| Wetland | 22 | 0.35 | 11 | 0.17 | 12 | 0.18 | 6 | 0.09 |
| Open water | 222 | 3.5 | 148 | 2.34 | 71 | 1.11 | 24 | 0.38 |
| Cultivated land | 626 | 9.86 | 1,229 | 19.37 | 1,701 | 26.8 | 1,701 | 26.81 |
| Built-up area | 499 | 7.87 | 1,378 | 21.72 | 1,880 | 29.63 | 2,111 | 33.26 |
| Total | 6,345 | 100 | 6,345 | 100 | 6,345 | 100 | 6,345 | 100 |
Table 3. Land use and land cover area and percentage, 1994–2025.
As shown in Table 3, in 1994, the landscape was dominated by natural vegetation, with forests covering 1,513 ha (23.84%), woodland 1,429 ha (22.53%), and riverine forest 1,149 ha (18.11%), together accounting for approximately two-thirds of the total catchment area. Shrubland occupied 884 ha (13.94%), while cultivated land and built-up areas covered only 626 ha (9.86%) and 499 ha (7.87%), respectively. Wetlands and open water represented relatively small proportions of the catchment, occupying 22 ha (0.35%) and 222 ha (3.50%), respectively.
By 2005, considerable changes had already occurred. Forest cover declined to 930 ha (14.66%), representing a reduction of nearly 40% compared with 1994. Woodland also decreased substantially to 916 ha (14.43%), while shrubland declined to 628 ha (9.90%). In contrast, cultivated land nearly doubled, increasing to 1,229 ha (19.37%), whereas built-up land expanded dramatically to 1,378 ha (21.72%), becoming one of the dominant land use categories in the catchment. These changes suggest rapid agricultural expansion and urban development during the first decade of the study period (Figure 3).
The trend continued between 2005 and 2016, although at varying rates among land cover classes. Woodland experienced the most pronounced decline, decreasing to 479 ha (7.55%), while shrubland was reduced to only 263 ha (4.15%). Forest cover showed a slight recovery to 966 ha (15.22%), possibly reflecting localized regeneration or afforestation efforts, although the increase was insufficient to offset the substantial losses recorded during the previous decade. Cultivated land expanded further to 1,701 ha (26.80%), and built-up land increased to 1,880 ha (29.63%), indicating continued pressure from agricultural development and urbanization. Riverine forests also declined from 1,105 ha to 974 ha, suggesting increasing anthropogenic disturbance of riparian ecosystems (Figure 4).
The most recent land cover map (2025) demonstrates that human-dominated land uses have become the predominant landscape components. Built-up areas expanded to 2,111 ha (33.26%), representing the largest land cover class within the catchment, while cultivated land remained extensive at 1,701 ha (26.81%). Conversely, forest cover declined further to 885 ha (13.95%), woodland decreased to 316 ha (4.99%), and wetlands were reduced to only 6 ha (0.09%). Open water also decreased markedly from 222 ha (3.50%) in 1994 to only 24 ha (0.38%) in 2025, indicating considerable contraction of surface water resources over the study period. Riverine forest remained relatively stable compared with other natural vegetation types, occupying 1,002 ha (15.78%), although this still represents an overall decline from its 1994 extent (Table 4).
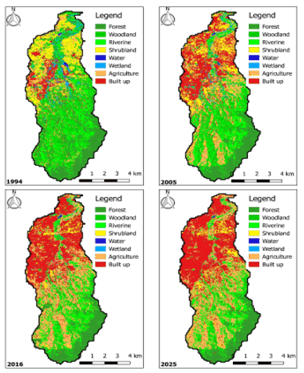
Figure 3. Land use and land cover maps for the period 1994–2025.
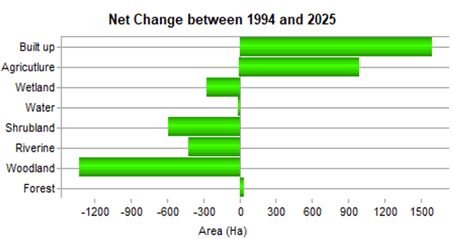
Figure 4. Net change in each land use/cover category between 1994 and 2025.
| LULC | 1994-2005 | 1994-2005 | 1994-2005 | 2005-2016 | 2005-2016 | 2005-2016 | 2016-2025 | 2016-2025 | 2016-2025 | 1994-2025 | 1994-2025 | 1994-2025 |
| Area (ha) | % | Ha/yr | Area (ha) | % | Ha/yr | Area (ha) | % | Ha/yr | Area (ha) | % | Ha/yr | |
| Forest | -583 | -38.53 | -53 | 36 | 3.84 | 3 | -81 | -8.37 | -10 | -628 | -41.51 | -21 |
| Woodland | -514 | -35.93 | -47 | -437 | -47.66 | -40 | -163 | -33.98 | -20 | -1,113 | -77.86 | -37 |
| Riverine forest | -44 | -3.82 | -4 | -131 | -11.86 | -12 | 27 | 2.82 | 3 | -148 | -12.84 | -5 |
| Shrubland | -257 | -29 | -23 | -365 | -58.08 | -33 | 37 | 14.12 | 5 | -584 | -66.03 | -19 |
| Wetland | -11 | -50.2 | -1 | 1 | 5.69 | 0 | -6 | -50.77 | -1 | -16 | -74.09 | -1 |
| Open water | -74 | -33.35 | -7 | -77 | -52.28 | -7 | -46 | -65.65 | -6 | -198 | -89.07 | -7 |
| Cultivated land | 603 | 96.45 | 55 | 472 | 38.38 | 43 | 1 | 0.04 | 0 | 1,076 | 171.95 | 36 |
| Built-up area | 879 | 175.98 | 80 | 502 | 36.4 | 46 | 231 | 12.28 | 29 | 1,611 | 322.65 | 54 |
Table 4. Land use and land cover change statistics (area, percentage and annual rate of change), 1994–2025.
Magnitude and trends of land use and land cover change (1994–2025): The analysis of land use and land cover change revealed substantial and uneven transformations across different land cover classes within the Morogoro river subcatchment over the period 1994 to 2025 (Figure 5). The magnitude, direction, and rate of change varied significantly among land cover types, reflecting the influence of both anthropogenic pressures and localized environmental processes within the subcatchment.
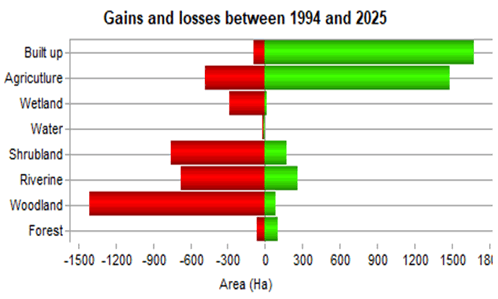
Figure 5. Land use/cover gains and losses between 1994 and 2025.
Over the entire study period, natural vegetation experienced a persistent decline (Figures 6 and 7). Forest cover decreased by 628 ha (41.51%), while woodland exhibited the most severe reduction, declining by 1,113 ha (77.86%). Shrubland also declined substantially by 584 ha (66.03%), indicating widespread degradation of non-cultivated vegetation types. Wetlands and open water bodies showed severe reductions of 74.09% and 89.07%, respectively, highlighting increasing pressure on aquatic ecosystems.
In contrast, human-dominated land uses expanded rapidly. Cultivated land increased by 1,076 ha (171.95%), while built-up areas experienced the most dramatic expansion, increasing by 1,611 ha (322.65%) over the same period. These findings indicate a strong and sustained conversion of natural ecosystems into agricultural and urban land uses, driven by population growth, infrastructure development, and increasing demand for food and settlement space.
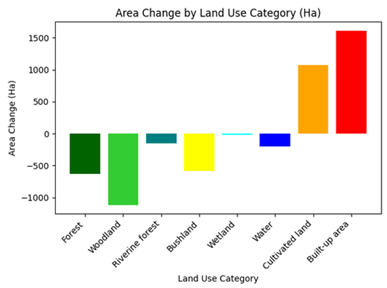
Figure 6. Area change in each land use category between 1994 and 2025.
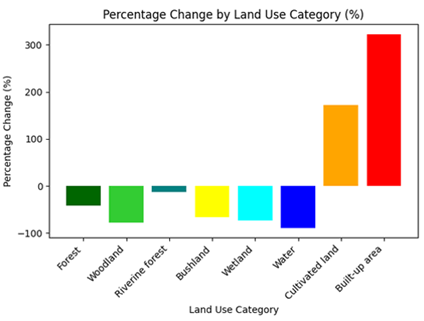
Figure 7. Percentage change in each land use category between 1994 and 2025.
Land use and land cover transition pathways: The land use and land cover transition matrix is presented in Table 5. The diagonal elements of the transition matrix represent areas that maintained the same land cover class throughout the study period.
| 1994-2025 | FRST | WOOD | RVF | SHRUB | WET | WATR | CULT | BULT | Total |
| FRST | 790 | 41 | 49 | 0 | 0 | 2 | 1 | 0 | 885 |
| WOOD | 42 | 209 | 41 | 3 | 3 | 10 | 6 | 1 | 316 |
| RVF | 205 | 128 | 608 | 6 | 1 | 19 | 24 | 10 | 1,002 |
| SHRUB | 21 | 100 | 14 | 126 | 0 | 5 | 24 | 9 | 300 |
| WET | 0 | 0 | 0 | 0 | 4 | 1 | 0 | 0 | 6 |
| WATR | 0 | 3 | 8 | 0 | 0 | 12 | 0 | 1 | 24 |
| CULT | 361 | 570 | 342 | 119 | 6 | 80 | 167 | 55 | 1,701 |
| BULT | 88 | 378 | 85 | 628 | 7 | 93 | 409 | 423 | 2,111 |
| Total | 1,509 | 1,429 | 1,148 | 883 | 22 | 222 | 632 | 499 | 6,345 |
| Note: FRST=Forest; WOOD=Woodland; RVF=Riverine Forest; SHRUB=Shrubland; WET=Wetland; WATR=Open water; CULT=Cultivated land; BULT=Built-up land. Rows show 1994 classes; columns show corresponding 2025 classes. | |||||||||
Table 5. Land use and land cover transition matrix, 1994–2025 (ha).
The transition matrix reveals that forest ecosystems experienced considerable transformation during the study period. Of the approximately 1,509 ha of forest existing in 1994, only 790 ha remained as forest by 2025, while 361 ha were converted into cultivated land, 205 ha transitioned into riverine forest, 88 ha became built-up areas, and smaller portions changed to woodland and shrubland. The substantial conversion of forest into cultivated land demonstrates that agricultural expansion has been one of the principal drivers of forest loss within the catchment. Meanwhile, the emergence of built-up areas within formerly forested landscapes indicates progressive urban encroachment, particularly around expanding settlements and transportation corridors. These changes reduce canopy cover, diminish carbon storage, and weaken the catchment's capacity to regulate runoff and protect soils from erosion.
Woodland experienced the greatest level of transformation among all natural vegetation classes. From an initial extent of 1,429 ha in 1994, only 209 ha remained woodland in 2025. The largest proportion of woodland (570 ha) was converted into cultivated land, followed by 378 ha that became built-up areas. Additional areas transitioned into riverine forest (128 ha), shrubland (100 ha), and forest (41 ha). This pattern indicates that woodland has served as the primary source of land for agricultural development and urban expansion. The extensive loss of woodland is likely associated with its relatively open canopy, which makes it easier to clear for cultivation, settlement development, fuelwood collection, and charcoal production. Consequently, the dramatic decline in woodland cover has probably reduced habitat connectivity, increased soil exposure, and accelerated land degradation processes within the catchment.
Riverine forests displayed relatively higher resilience than woodland but still experienced considerable conversion. Of the 1,148 ha present in 1994, 608 ha remained unchanged, while 342 ha were converted into cultivated land and 85 ha into built-up areas. Smaller areas transitioned into forest (49 ha) and woodland (41 ha). The conversion of riparian vegetation into agriculture is particularly concerning because riverine forests provide essential ecosystem services, including bank stabilization, sediment trapping, nutrient filtration, and regulation of stream temperature. Their degradation increases the direct connectivity between agricultural fields and river channels, thereby facilitating the transport of sediments, fertilizers, pesticides, and other pollutants into the Morogoro river during rainfall events.
Shrubland also underwent substantial transformation over the study period. Of the original 883 ha, only 126 ha remained as shrubland in 2025. Significant portions were converted into built-up areas (628 ha) and cultivated land (119 ha), while relatively small areas transitioned into woodland (100 ha) and riverine forest (14 ha). The dominance of shrubland conversion to built-up land suggests that urban growth has largely occurred on previously open vegetated areas surrounding existing settlements. Such expansion is typical of rapidly growing urban centres, where shrublands are often perceived as vacant or underutilized land suitable for residential, commercial, and institutional development.
The transition matrix further indicates that cultivated land expanded primarily through the conversion of forests, woodland, riverine forests, and shrublands. Collectively, these natural vegetation classes contributed the majority of newly cultivated land observed in 2025, confirming that agricultural expansion has occurred largely at the expense of natural ecosystems. Likewise, the continued expansion of built-up areas was supported by the conversion of woodland, shrubland, cultivated land, and forest, illustrating the increasing competition between urban development, agriculture, and environmental conservation for limited land resources.
Overall, the transition pathways demonstrate a clear shift from a landscape dominated by natural vegetation towards one increasingly characterized by agricultural production and urban infrastructure. The systematic replacement of forests, woodland, shrubland, and riverine vegetation by cultivated and built-up land has fundamentally altered the ecological structure and functioning of the catchment.
Persistence of land cover classes: Forest exhibited the highest persistence among the natural vegetation classes (Figure 8), with 790 ha remaining unchanged from 1994 to 2025, representing approximately 52.4% of the original forest area. Riverine forest also showed relatively high persistence, with 608 ha (approximately 53.0%) remaining intact. In contrast, woodland retained only 209 ha, representing approximately 14.6% of its 1994 extent, while shrubland retained only 126 ha (approximately 14.3%). Water bodies and wetlands exhibited very low persistence, with only 4 ha and 12 ha, respectively, remaining unchanged. Among the human-dominated land uses, cultivated land retained 167 ha (approximately 26.4%) of its original extent, whereas built-up areas retained 423 ha, representing approximately 84.8% of the built-up land present in 1994. These findings indicate that urban areas were highly permanent once established, whereas natural vegetation, particularly woodland and shrubland, was highly susceptible to conversion.
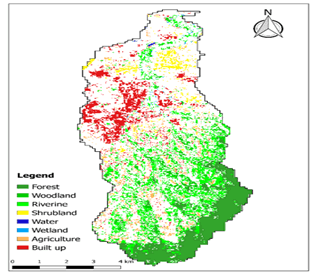
Figure 8. Land use/cover persistence map, 1994–2025.
Future land use and land cover prediction (2035–2055): The validated Cellular Automata–Markov (CA–Markov) model was used to project future Land Use and Land Cover (LULC) dynamics for the years 2035, 2045, and 2055. The projections provide insights into the likely trajectory of landscape transformation in the Morogoro river subcatchment under the assumption that historical land transition probabilities and the underlying driving forces remain relatively constant. The predicted maps (Figure 9) and area statistics (Table 6) indicate that the catchment is expected to experience continued expansion of anthropogenic land uses at the expense of natural vegetation, with important implications for ecosystem integrity and water resource sustainability.
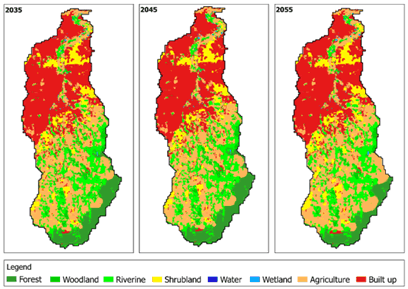
Figure 9. Predicted land use and land cover maps of the Morogoro river subcatchment.
The model predicts that forest cover will continue to decline throughout the projection period. Forest area is expected to decrease from 885 ha in 2025 to 725 ha in 2035, 568 ha in 2045, and 410 ha in 2055, representing a total reduction of 475 ha (53.63%) over the 30-year period. Similarly, woodland is projected to decline from 316 ha to 200 ha, corresponding to a loss of 116 ha (36.66%). These projections suggest that, if current land-use practices continue, the remaining natural forests and woodlands will experience increasing fragmentation and degradation, thereby reducing their capacity to provide essential ecosystem services such as carbon sequestration, biodiversity conservation, soil protection, and regulation of watershed hydrological processes.
Riverine forests are projected to experience relatively small changes compared with other natural vegetation classes. The model indicates a gradual decline from 1,002 ha in 2025 to 963 ha by 2055, representing an overall reduction of approximately 3.85%. This comparatively high level of persistence suggests that riparian vegetation may remain relatively protected because of its location along river channels and the influence of environmental regulations that restrict land conversion within riparian zones. Nevertheless, even modest reductions in riverine forest can weaken the ecological functions of riparian buffers, including bank stabilization, sediment retention, nutrient filtration, and regulation of stream temperature. Continued encroachment into these areas may therefore have disproportionate effects on river health despite the relatively small projected decline.
| LULC | 2025 (ha) | 2035 (ha) | 2045 (ha) | 2055 (ha) | 2025-2055 | 2025-2055 | 2025-2055 |
| Area change (ha) | % | Ha/yr | |||||
| Forest | 885 | 725 | 568 | 410 | -475 | -53.63 | -16 |
| Woodland | 316 | 278 | 239 | 200 | -116 | -36.66 | -4 |
| Riverine forest | 1,002 | 989 | 976 | 963 | -39 | -3.85 | -1 |
| Shrubland | 300 | 405 | 508 | 610 | 310 | 103.15 | 10 |
| Wetland | 6 | 3 | 0 | 0 | -6 | -98.44 | 0 |
| Open water | 24 | 25 | 26 | 27 | 3 | 11.11 | 0 |
| Cultivated land | 1,701 | 1,790 | 1,888 | 1,986 | 284 | 16.71 | 9 |
| Built-up area | 2,111 | 2,130 | 2,140 | 2,149 | 38 | 1.8 | 1 |
Table 6. Projected land use and land cover area and change statistics, 2025–2055.
Unlike forest and woodland, shrubland is projected to increase substantially during the prediction period. The area covered by shrubland is expected to expand from 300 ha in 2025 to 610 ha in 2055, representing an increase of 310 ha (103.15%). This increase may reflect secondary vegetation succession in abandoned agricultural fields, natural regeneration following disturbance, or the degradation of woodland into shrub-dominated vegetation. Consequently, although shrubland may contribute to improved vegetation cover, it does not fully compensate for the ecological functions provided by mature forests and woodlands.
Wetlands are projected to undergo the greatest proportional decline among all land cover classes. The model predicts that wetland area will decrease from 6 ha in 2025 to complete disappearance by 2045, indicating a 98.44% reduction over the projection period. This projected loss is particularly alarming because wetlands perform critical ecological functions, including flood attenuation, groundwater recharge, nutrient retention, and maintenance of aquatic biodiversity. Their disappearance would likely reduce the resilience of the catchment to extreme rainfall events and increase downstream flood risks and water quality deterioration. Conversely, the model predicts only a slight increase in open water area from 24 ha to 27 ha, suggesting relatively stable surface water extent despite ongoing landscape changes. However, an increase in water surface area does not necessarily indicate improved water resource conditions, as water quality may continue to decline due to increasing sedimentation and pollutant loading (Figure 10).
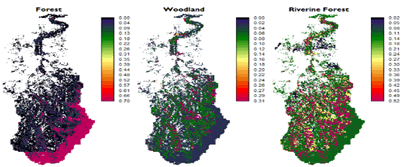
Figure 10. Markovian conditional probability of being forest, woodland, and riverine forest.
The projections further indicate continued expansion of cultivated land, increasing from 1,701 ha in 2025 to 1,986 ha by 2055, representing a gain of 284 ha (16.71%). This trend reflects the anticipated increase in demand for agricultural land to support population growth and food production. Agricultural expansion is expected to continue replacing remaining natural vegetation, particularly in areas suitable for cultivation. Without the widespread adoption of sustainable land management practices, this expansion may intensify soil erosion, nutrient leaching, and agrochemical runoff into river systems.
Built-up areas are also projected to increase, although at a slower rate than observed during the historical period. The model predicts that built-up land will expand from 2,111 ha in 2025 to 2,149 ha in 2055, representing a modest increase of 38 ha (1.80%). The slower rate of urban expansion may indicate that most suitable land for settlement has already been developed or that physical constraints and planning regulations may limit future urban growth. Nevertheless, even limited increases in impervious surfaces can significantly influence watershed hydrology by increasing runoff, reducing groundwater recharge, and accelerating the transport of pollutants into streams (Figure 11).
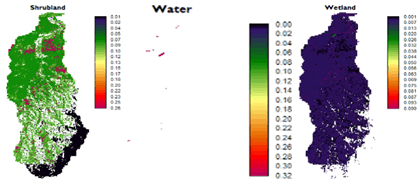
Figure 11. Markovian conditional probability of being shrubland, water, and wetland.
Overall, the predicted LULC scenarios indicate that the Morogoro river subcatchment will continue to experience increasing anthropogenic pressure under a business-as-usual scenario (Figure 12).
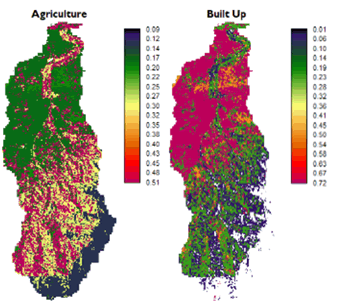
Figure 12. Markovian conditional probability of being agriculture and built-up.
The findings of this study reveal substantial Land Use and Land Cover (LULC) transformation in the Morogoro River Catchment between 1994 and 2025, characterized by the expansion of agricultural land and built-up areas alongside declines in forest, woodland, riverine vegetation, and wetlands. These changes indicate increasing human pressure driven by agricultural intensification, urban development, and population growth. Similar patterns have been widely documented across Tanzania and other tropical developing countries, where socio-economic development has accelerated the conversion of natural ecosystems into agricultural and urban landscapes (Msofe et al., 2019; Doggart et al., 2020; Winkler et al., 2021; Assede et al., 2023).
Agricultural expansion emerged as the dominant driver of landscape transformation within the catchment. Rising food demand associated with population growth has encouraged the conversion of forests, woodlands, and wetlands into cultivated land, particularly in the middle and lower sections of the catchment, as confirmed through field observations. This conversion reduces vegetation cover, exposes soils to erosion, increases surface runoff, and ultimately accelerates sediment transport into river systems. Comparable findings have been reported across East Africa, where agricultural expansion has been identified as a major cause of catchment degradation, increased sediment production, and declining ecosystem services (Gashaw et al., 2014; Mwangi et al., 2018; Shi et al., 2024). These findings reinforce the established understanding that agricultural expansion remains one of the leading drivers of land degradation and water resource deterioration in tropical river basins.
The increase in built-up areas reflects rapid urbanization within Morogoro municipality and surrounding peri-urban areas, driven by population growth, rural-to-urban migration, infrastructure development, and increasing housing demand. Urban expansion replaces permeable surfaces with impervious infrastructure, reducing infiltration while increasing stormwater runoff and pollutant transport into rivers. Similar trends have been reported across African cities where weak land-use planning and inadequate enforcement of environmental regulations have accelerated encroachment into environmentally sensitive areas (Kändler et al., 2017; Mbonaga et al., 2024). Without effective urban planning, continued settlement expansion is likely to place additional pressure on both water quantity and water quality.
The decline in forest, woodland, riverine vegetation, and wetlands has important implications for catchment hydrology and freshwater quality. Forests regulate streamflow, stabilize soils, promote groundwater recharge, and reduce sediment transport, while riparian vegetation and wetlands act as natural buffers by trapping sediments, filtering nutrients, stabilizing riverbanks, and improving water quality through natural purification processes. Their degradation weakens the catchment's capacity to regulate hydrological processes and increases the transfer of sediments and pollutants into rivers. Similar declines in these ecosystems have been reported across Tanzania and other tropical catchments experiencing agricultural expansion, settlement growth, charcoal production, and infrastructure development (Munishi et al., 2010; Doggart et al., 2020; Locke, 2024; Shi et al., 2024). Recent global evidence further links forest loss and riparian degradation with increased sediment loads, nutrient export, and declining freshwater quality (Shi et al., 2024). Collectively, these findings highlight the importance of protecting forests, riparian vegetation, and wetlands to sustain hydrological functions, improve water quality, and maintain the long-term ecological integrity of the Morogoro river catchment.
This study demonstrates that the Morogoro river catchment has experienced significant land use and land cover (LULC) transformations between 1994 and 2025, driven primarily by agricultural expansion, urban growth, and increasing human pressure on natural ecosystems. The observed increase in cultivated land and built-up areas, coupled with the decline of forests, woodlands, riverine vegetation, and wetlands, highlights a progressive conversion of natural landscapes into human-dominated systems. These changes have important implications for catchment functioning, particularly through reduced vegetation cover, increased surface runoff, soil erosion, and greater vulnerability of freshwater resources to degradation.
The study provides valuable evidence for policymakers, conservation practitioners, and local stakeholders to support integrated catchment management in the Morogoro river catchment. Future management strategies should prioritize balancing socio-economic development needs with ecosystem conservation to enhance the resilience of the catchment under increasing population growth and climate variability. Continuous monitoring of LULC dynamics using remote sensing and GIS approaches is also recommended to support adaptive decision-making and evaluate the effectiveness of restoration and conservation interventions over time.
The authors wish to express their sincere gratitude to all individuals, collaborators, and institutions that directly or indirectly supported this research endeavor. Their collective contributions were vital in making this study possible.
The authors declare no conflicts of interest regarding the publication of this paper.
[Crossref] [Google Scholar] [PubMed]
[Crossref] [Google Scholar] [PubMed]
[Crossref] [Google Scholar] [PubMed]
[Crossref] [Google Scholar] [PubMed]
[Crossref] [Google Scholar] [PubMed]
Select your language of interest to view the total content in your interested language