
Research Article - (2026) Volume 16, Issue 1
Received: 22-Feb-2026, Manuscript No. AJES-26-185504; Editor assigned: 25-Feb-2026, Pre QC No. AJES-26-185504 (PQ); Reviewed: 11-Mar-2026, QC No. AJES-26-185504; Revised: 20-Mar-2026, Manuscript No. AJES-26-185504 (R); Published: 27-Mar-2026
This study assessed the boat building and repairs endowment of Akwa Ibom State in order to ascertain its potential for the development of the state in the context of the blue economy. A total of 29 coastal communities with a direct connection to the Atlantic Ocean were selected from the five local government areas of the state. Using the observation method, information was collected on some boatyard, types of boat/canoes produced, methods of production, sources of materials, and methods of repairs. Information was collected on some shipyard, types of boat/canoes produced, methods of production, sources of materials, and methods of repairs. Findings showed that there were only five local shipyards in the study area located at Esin Ufot, Ibaka Mbe Ndoro, Qua Iboe River Estuary, Emereoke communities. These were found to be grossly inadequate considering the potential of marine related activities in the study area. For the current economic evaluation of the marine transportation sector of the blue economy in the study area, the consumer Willingness-to-Pay (WTP) method in market price approach was employed using the consumer surplus. A high consumer surplus was reported for the boat building and repairs sector of the state’s blue economy, generally indicating that consumers are better off, as they are receiving high values from boat making and repairs relative to their cost. Following from that, it was recommended that boat building and repairs be given greater attention for its potential for job creation, revenue-generating, investment and industrial development with local and recreational amenity value increase.
Harnessing, Marine transportation, Potential, Framework, Blue economy
Boat building and repairs encompass the construction, maintainance, and refitting of vessels, driving job creation, supporting maritime transportation, tourism, fishing, and defense, and offering significant potential for sustainable blue economy. It is a vital part of the blue economy as it supports jobs, generates revenue and is essential for all other blue economy activities such as fishing fleets for local food and small cargo transportation vessels. It helps in developing local capacity to decongest roads, improve internal trade, improving safety, enabling sustainable harvesting and boasting local food security should be one of the goals of this sector. In the USA, this sector saw significant growth, with sales increasing by 14.6% to reach 20m Dollars in 2022 (US Bureau of Economic Analysis, 2025).
Valuing boat building and repair in developing nations involves recognizing their crucial role in local economies, leveraging lower labour costs for competitive pricing, adapting to local needs such as using traditional materials and small fishing boats, and capturing growing global demand for new builds driven by alternative fuels and maintainace. It was, therefore, necessary to carried out this study to assess the boat building and repairs endowment of Akwa Ibom State in order to ascertain and tap into its potential for the development of the state in the context of the blue economy.
In the last decade a growing number of environmental scientists have advocated economic valuation of ecosystem services as a pragmatic short-term strategy to communicate the value of biodiversity in a language that reflects dominant political and economic views. Gómez-Baggethun and Ruiz-Pérez, (2011) in economic valuation and the commodification of ecosystem services revisited the controversy on economic valuation of ecosystem services in the light of two aspects that are often neglected in ongoing debates. First, the role of the particular institutional setup in which environmental policy and governance was currently embedded in shaping valuation outcomes. Second, the broader economic and sociopolitical processes that have governed the expansion of pricing into previously non-marketed areas of the environment. The advocacy of valuing ecosystem services in monetary terms is embedded in the logic of market environmentalism, prominent since the late 1980’s alongside the expansion of the neoliberal ideology (Bakker, 2005). One method used in the valuation of market-based resources and services is contingency evaluation using willingness to pay. This is a survey-based economic method which works by asking individuals hypothetical questions about their willingness to pay for goods or services or their willingness to accept compensation for loss, placing a monetory value on these non-market goods in a simulated market scenario. The reliability depends on carful survey design to minimize bias and ensure the validity of the hypothetical contex. Respondents are asked how much they will be willing to pay for an improvement in the resource (WTP) or how much they will be Willing to Accept (WTA).
Governments use economic valuations to inform policy decisions, ensuring that economic activities do not come at the cost of depletion of natural resources. These valuatiomns guide taxation, subsidies, or regulations to encourage sustainable practices. Also, valuing natural resources can assist in determining fair market prices for goods and services derived from nature, leading to more accurate pricing in industries such as agriculture, fishing and energy (Chi, 2025). Proper resource evaluation ensures that nature resources are used effectively and sustainably. By understanding their values, societies can implement strategies to conserve resources, prevent depletion, and protect ecosystem for future generations. It also helps in understanding the long–term impacts of resource use on the environment and highlights the hidden costs of environmental degradation, such as pollution, habitat destruction, climate change, which can be factored into the decision – making process.
Study area
The study area is located in the Niger Delta region of Nigeria. The area is a stretch of coastal area along the Bight of Bonny on the Atlantic Ocean. It has a shoreline approximately 119.64 km in length and spans from a point at Eastern Obolo on latitude 4°28'N and longitude 7°55'E to Oron on latitude 4°50'N and longitude 8°14'E (Udosen et al., 2014; Ekong, 2017; Udoudo, Emengini, and Igbokwe, 2019).
The area has two distinct seasons namely the wet or rainy and the dry season. The climate characteristics correspond to Koppen’s climate classification. It is characterized by very high rainfall (annual totals >4000 mm), high temperatures values of about 27°C, and high values of relative humidity with a mean value of 80.3%. It has been suggested that shoreline erosion rates are expected to change in response to changes in climate (Atser et al., 2010). Also, very high climatic factors will lead to an increase in the rate of shoreline change. The present study is a move to show what has happened to the area with the current climate change.
The general vegetation class of the study area can be divided from the shoreline as Mangrove/Nypa palms/phoenix belt, the secondary forest, the oil palm and abandoned farmlands and fallowed areas. The geomorphology of the study area consists of level to gently undulating sandy plains. The terrain is heavily incised by numerous creeks, shallow streams, rivers, although, they are few and far between in the Northern part of the study area. Long rectilinear slopes (>400 m) with gentle inclinations of less than 50 m, shallow depressions and water-logged valley bottoms constitute the major landforms. During the rainy season, many of the depressions may be inundated but consist of heaps of sand and sometimes thick deposits of clay when the water subsides. Generally, the relief of the study area ranges from less than 3 metres above sea level along the beach to about 45 metres inland. The gently-sloping beaches, wave breakers and a few small swamps systems are prone to flooding. The beaches were probably formed during the development of coastal basins and trough spanning the entire Gulf of Guinea in the cretaceous era (Akipoftz, 2015; Ekong, 2017).
In terms of the socio-economic activities in the area, there is a high level of dependence on natural resources for livelihood sustenance. Fishing is a male-dominated enterprise while women dominate the gathering of periwinkles and crabs from the shallow swamps and dry season farming. The women also exploit the mangrove forest for firewood and gathering non-timber forest products such as mushroom, wild fruits and vegetables. They also process raw fish via drying or smoking and engage in the farming of local food crops (cassava, yams, cocoyam among others) (Ekong, 2017).
Through the advent of oil exploration and the sitting of Exxon Mobil, Qua Iboe Terminal at Ibeno and migration of a large population the area has witnessed tremendous human activities (Figure 1). These human activities in turn result in the removal and disappearance of the native vegetation from the area thereby making the soil easily eroded (Ekong, 2017).

Figure 1. Study area map showing coastal area and communities.
Population and sample size
For the respondents, all the community heads, boat builders and repairers participated in the study. In the course of the administration of the questionnaire, there were no records available to show the population figures of the selected communities. In a situation where the population size is infinite or cannot be accurately estimated in terms of respondents, Godden’s, (2004) opined that the infinite population sampling formula can be used to determine the sample size. Thus, a sample size of three hundred and eighty-four (384) respondents was adopted for this study using Bill Godden 2004 sample size determination formula as shown:
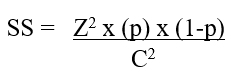
Where:
Z=1.96 Z value (1.96 for 95% confidence level)
P=0.5 percent picking a choice, expressed as a decimal (.5 used for sample size needed)
C=5% confidence interval, expressed as decimal (0.05).
Thus:
In order to give more reliable results with greater precision and power, it was necessary to double the sample size of 384 to 768 for the purpose of this study
A sampling of the respondents involved travelling to the location of the study area, and living with the people for proper acquisition of data, i.e., each household were purposively chosen and respondents not less than 18 years were administered the questionnaire. Some 768 copies of the questionnaire were administered in the entire 29 communities as presented in Table 1. While 26 copies of the questionnaire were proportionally administered to all the villages, 28 copies were judgmentally administered to some villages due to the observed level of development among the selected communities. An attempt was made by the research team to eliminate gender inequality in the course of the administration of the questionnaire. It also involves the assistance of a locally trained field assistant for each local government area. Furthermore, copies of the questionnaire were administered to respondents to acquire information on the contribution of ocean-based resources and services to the local livelihood system.
First, a pre-field was conducted over the entire coastline as an avenue for consultation from Oron, Udung Uko, Mbo, Ibeno, to Eastern Obolo. Letters of introduction were served and dates were fixed for the real studies after which the actual study begins with the research team. Data collection was only carried out on Sundays. The justification for this was that the major occupation of the people is fishing, hence, respondents needed for the study were only available on Sundays which is their resting days and engagement in other activities such as religion among others were minimal.
| Communities | Copies of administered questionnaire |
| ORON | |
| Esin Ufot | 28 |
| Esuk Oron | 28 |
| Idua Afaha Eduaok | 26 |
| Idua Asang | 28 |
| Idua Esit Edek | 26 |
| Idua Ukpata | 26 |
| Ine Ekong | 26 |
| MBO | |
| Aqua Obio Effiat | 26 |
| Esuk Effiat | 26 |
| Esuk Enwang | 26 |
| Ibaka | 28 |
| Ibuot Ikot | 26 |
| Inua Abasi | 26 |
| Mbe Ndoro | 26 |
| Okposo 1 and 2 | 26 |
| Unyeghe | 28 |
| IBENO | |
| Akata | 26 |
| Atia | 26 |
| Edetsie | 26 |
| Inua Eyet Ikot | 28 |
| Itak Afaha | 26 |
| Itak Edim Ukpe | 26 |
| Iwu Owo Okpolom | 26 |
| Ndito Eka Iba | 26 |
| Okom Ita | 26 |
| EASTERN OBOLO | |
| Emereoke | 28 |
| Elekpon | 26 |
| Obianga | 26 |
| UDUNG UKO | |
| Itakakpa | 26 |
| Total | 768 |
Table 1. Proportion of administered questionnaire.
Instrument for data collection
The study adopted different methods for data collection which are observation and questionnaire. The questionnaire was used as an instrument for data collection which was structured to answer relevant questions needed for the study, as well as field observations of various indicators to verify the information supplied. The questionnaire was constructed and designed in two languages which included formal language (English language), and the indigenous language. GPS co-ordinate was taken using GPS, and a recording book was used for documentation.
Economic valuation method
To determine the current economic valuation of ocean-based resources and services within the blue economic framework, Lipton et al., (1995) and Ulibarri and Wellman, (1997) adopted market price using consumer surplus methods. The consumer surplus represents the difference between the highest price a consumer is willing to pay for a good or service and the actual price they pay. It is the benefits consumers receive when they purchase a product for less than their maximum willingness to pay. This is given as;
Consumer Surplus=The actual customer expenditure-additional expenditure
Where;
The actual customer expenditure=Minimum price × Quantity purchased
Additional expenditure=Maximum price × Quantity purchased.
Weaknesses of valuing resources using the consumer surplus approach include subjectivity in measurement of willingness to pay, ignoring the income effect which dictates that a change in in price changes a consumers’ real income, subsequently altering their demand, and its irrelevance for necessities such as water, salt, medicines etc. Contigency Evaluation Methods (CEM) which uses Willingness-to-Pay, relies on hypothetical scenarios rather than actual market behavior. Leading to various biases and questioning the validity and reliability of the results. This means that respondents may overstate their WTP because they do not actually have to pay the amount stated often called “rubber money responses, leading to an overestimation of values.” According to (Silvertown, 2015), one source of concern is the cognitive demands that it places on respondents in terms of understanding the policy being valued. Unless respondents understand what is being valued, and believe their answers to be consequential in influencing the policy choice, the cannot be expected to give meaning full answers.
Method of data analysis
Data acquisition: Data for this study was generally primary. The dataset for the study is presented in Table 2.
|
Blue economy sector |
Variables |
Measurement |
Type of data |
|
|
|
Resources |
Services |
|
|
|
Ship building/Repairs |
The number of a shipyard, types of boat/canoes produced, methods of production, sources of materials, and methods of repairs. (fieldwork) |
Frequency types |
Primary data |
|
Table 2. Dataset for boat building and repairs.
As consumers age, gender, income, educational status and where they live can impact on WTP (Anand, 2020), as cited in Harvad Business School Online (2020), it was necessary to investigate these attributes for a proper knowledge of their willingness to pay for boat building and repairs in the study area.
Socioeconomic characteristics of the respondents
Age of respondents: Table 3 shows that about 21% of the respondents were between 20 and 29 years of age, and about 37% of the respondents were of ages of between 30 and 39 years of age. Respondents of 60% and above were the least (7.6%) in the sample.
| Age | Number of respondents | Percentage |
| 20–29 | 160 | 20.80% |
| 30–39 | 280 | 36.50% |
| 40–49 | 150 | 19.50% |
| 50–59 | 120 | 15.60% |
| 60 and above | 58 | 7.60% |
| Total | 768 | 100 |
Table 3. Age of respondents.
Marital status of respondents: The study investigated the marital status of respondents across the sampled communities, as detailed in Table 4. From the analysis of the marital status, of respondents, it was seen that 24.5% of the respondents sampled were single, 23.5% were married, 29.8% were divorced and 22.2% were widowed/widowers.
| Marital status | Number of respondents | Percentage (%) |
| Single | 188 | 24.5 |
| Married | 181 | 23.5 |
| Divorced | 228 | 29.8 |
| Widow/Widower | 171 | 22.2 |
| Total | 768 | 100 |
Table 4. Marital status of respondents.
Educational qualifications of respondents: For the Educational status, the responses presented in Table 5 shows that close to 30% of the respondents had no formal education, 24.5% had primary education, 22.4% were products of secondary education. It must be noted that educational levels of the respondents play a key role in the economic valuation of non-market based resources where the economic implication is not easily understood.
| Educational qualification | Number of respondents | Percentage (%) |
| No formal education | 228 | 29.6 |
| Primary Education (FSLC) | 188 | 24.5 |
| Secondary education | 180 | 23.5 |
| Tertiary education | 172 | 22.4 |
| Total | 768 | 100 |
Table 5. Educational qualifications of respondents.
Occupational status of respondents: The study also investigated the occupational status of the respondents. Their responses are presented in Table 6:
| Occupation | Number of respondents | Percentage |
| Civil servants | 80 | 10.40% |
| Minners | 70 | 9.10% |
| Traders | 190 | 24.70% |
| Farmers | 120 | 15.60% |
| Fishermen | 380 | 40.20% |
| Total | 768 | 100 |
Table 6. Occupational status of respondents.
Table 6 shows that fishermen made up close to 40.2% of the respondents followed by traders with 24.7%. This confirms that the area is dominated by fishermen and traders.
Monthly income of respondents: The monthly income of the respondents was sought for in the study and is presented in Table 7. The table shows that 33.0% of the respondents earned income of below 30, 000 representing the largest group. This was followed by those who earned 100, 000 and above with 12.9%.
| Monthly income | Number of respondents | Percentage |
| Below 30, 000 | 260 | 33 |
| 30, 000–50, 000 | 178 | 23.2 |
| 51–100, 000 | 238 | 30.9 |
| 100, 000 and above | 92 | 12.9 |
| Total | 768 | 100 |
Table 7. Monthly income of respondents.
Status of boat building and repairs sector in the study area
Observation shows that there are no formally recognized boat building and repair industry in the study area. Despite this shortcoming in data availability for the research, few local-based boat building and repair industries were sighted. Using the observation method, under the boat building industries and repairs, information was collected on some boatyard, types of boat/canoes produced, methods of production, sources of materials, and methods of repairs.
The result in Table 8 indicates that there are only five local boatyards in the study area located at Esin Ufot, Ibaka Mbe Ndoro, Qua Iboe River Estuary, Emereoke communities. Figure 2 showed typical boatyards were boats/canoes were being produced along the Qua Iboe river estuary.

Figure 2. Local boat yard along the Qua Iboe River Estuary in Ibeno.
Furthermore, canoes and sailboats remain one of production especially for fishing and water transportation along the waterways. This is because their target market is the fishermen in the various fishing community.
|
Indicators for shipbuilding and repairs |
Status |
|
Number of shipyards |
5 boatyards (Esin Ufot, Ibaka Mbe Ndoro, Qua Iboe River Estuary, Emereoke communities) |
|
Type of boats and canoes |
Canoe and Sailboat |
|
Methods of production |
Designing, fabrication/sub assembling (cutting and welding), surface preparation, painting (water-based coasting and high-performance epoxy coasting), outfitting, testing, and delivery channel. |
|
Sources of material |
Local-based materials (sailcloth, timber, paddles), market-based materials (sail engine, anchor) |
|
Methods of ship repairs |
Blasting and repairs, rebuilding and installation, overhaul and maintenance, and repairs and alignment. |
Table 8. Boat building and repairs potential indicators.
There are different methods of producing boats/canoes locally as indicated on the Table 8. The first step is designing which is done by a local architect according to the customer's specification. Fabrication and sub assembling is done by local craft men which involve cutting and welding of materials. Surface preparation is the next phase where it is majorly done or directed by the chief craft man. Typical boatbuilding is in Figure 3. Thereafter, painting of the boat is carried out which is usually done in two regions of the boat. This includes water-based coasting and high-performance epoxy coasting as shown in Figure 3. The outfitting of the boat is done thereafter which involves the process of installing parts and various subassemblies. For example, the fitting of sail engine, anchor, among others. Finally, testing is done before delivery is made to clients.

Figure 3. Boat painting at Ibaka, Mbo.
The boat repairs aspect mainly involves four methods. The first is the blasting and painting of the ship's hull, fireboard, superstructure, interior tanks and the work area. Also, major machinery is needed for rebuilding and install old and new components if the needs arise. Thirdly, system overhauls and maintenance are usually done to avoid accidental breakdown of a ship in the sea (Figure 4). Lastly, most times, the propeller and rudder are usually checked from time to time and if needs be, repairs and alignment can be made for machine efficiency. An example of a ship repair process can be seen in Figure 5.

Figure 4. Typical boat building at Esin Ufot, Oron.

Figure 5. Boat repair activities at Mbe Ndoro, Mbo.
After careful study, observation revealed that there are no formally recognized shipbuilding and repair industry in the study area. Despite this shortcoming in data availability for the research, few local-based shipbuilding and repair industries were sighted. Using the observation method, under the shipbuilding industries and repairs, information was collected on some shipyard, types of boat/canoes produced, methods of production, sources of materials, and methods of repairs. The result revealed that there are only five local shipyards in the study area located at Esin Ufot, Ibaka Mbe Ndoro, Qua Iboe River Estuary, Emereoke communities. Furthermore, Canoes and sailboats remain one of production especially for fishing and water transportation along the waterways. This is because their target market is the fishermen in the various fishing community There are different methods of producing boats/canoes locally as indicated on the table. The first step is designing which is done by a local architect according to the customer’s specification. Fabrication and sub assembling is done by local craft men which involve cutting and welding of materials. Surface preparation is the next phase where it is majorly done or directed by the chief craft man. Thereafter, painting of the boat is carried out which is usually done in two regions of the boat. This includes water-based coasting and high-performance epoxy coasting. The outfitting of the boat is done thereafter which involves the process of installing parts and various subassemblies. For example, the fitting of sail engine, anchor, among others. Finally, testing is done before delivery is made to clients. The boat repairs aspect mainly involves four methods. The first is the blasting and painting of the ship’s hull, fireboard, superstructure, interior tanks and the work area. Also, major machinery is needed for rebuilding and install old and new components if the need arises. Thirdly, system overhauls and maintenance are usually done to avoid accidental breakdown of a ship in the sea. Lastly, most times, the propeller and rudder are usually checked from time to time and if needs be, repairs and alignment can be made for machine efficiency. Conclusively, the boat building industry is not being given special consideration despite it being one of the most integrated processing and assembly industry as opined by David, (2008). The boat building industry in the study is weak, localized and its sources of material are not environmentally friendly. The finding corroborated with results of Yang et al., (2016) in China that the industry manufacture low-end products mainly, which is still in the low-end links of the international shipbuilding industry chain. Therefore, to project the nation’s boat building industry among the key players in the international community, more needs to be done by stakeholders if the actualisation of the blue economy development is to be achieved. Economic valuation of boat building and repairs industry Since the identified boat building and repairs services are services that can be traded in the market, the market price approach using consumer surplus method was adopted to estimate the economic value based on net Willingness to Pay (WTP). According to Ulibarri and Wellman, (1997), consumer surplus is the difference between people's maximum willingness to pay (A+B) and what they actually paid (A). In essence, the area gives monetary measure of satisfaction that people received, less what they actually pay for it. Unlike the adoption of producer surplus in other sector, the boat building and repairs industry lack clear records or estimate to determine number of times boats are sold or repaired in a season. Hence, the consumer surplus was adopted. Table 9 showed the summary of prices and quantity of boat sold in a year in five identified boatyard site in the study area.
| Boatyard location | Minimum price | Maximum price | Quantity sold in a year |
| Esin Ufot | 2,000,000 | 2,500,000 | 3 |
| Ibaka | 1,500,000 | 2,000,000 | 2 |
| Mbe Ndoro | 1,000,000 | 1,500,000 | 1 |
| Qua Iboe River Estuary | 2,000,000 | 2,500,000 | 4 |
| Emereoke | 1,500,000 | 2,500,000 | 2 |
| Total | 8,000,000 | 11,000,000 | 12 |
| Mean | 1,600,000 | 2,200,000 | 2.4 |
Table 9. Summary of prices and quantity of boat sold in a year.
According to Lipton, Katherine, Isobel and Rodney, (1995), consumer surplus is the actual expenditure to purchase a particular goods subtracted from additional expenditure that customer is willing to make to purchase the same good. It represents the benefits consumers receive when they purchase a product for less than their maximum willingness to pay.
The actual customer expenditure=Minimum price × Quantity purchased:
= 1,600,000 × 2.4
= 3,840,000 naira
Additional expenditure that customer is willing to make= Maximum price × Quantity purchased:
= 2,200,000 × 2.4
= 5,280,000
Consumer Surplus = 5,280,000 - 3,840,000 = 1,440,000 (960 Dollars)
The result for the consumer surplus using market price is 1,440,000 Naira (960 Dollars). This figure represents the benefits consumers receive when they purchase a product or service in the boat building and repairs sector for less than their maximum willingness to pay. This value means that consumers in the boat building sector are collectively gaining N1,440, 000 (960 Dollars) in economic benefits when they purchase a product for less than their maximum willingness to pay.
Figure 6 shows the consumer surplus curve of the boat building and repairs sector.

Figure 6. Consumer surplus curve of the shipbuilding and repairs sector.
A WTP graph visualizes perceived value and market demand, guiding pricing by showing how much consumers value overall quantity. A higher consumer suplus generally indicates that consumers are better off, as they are receiving high values from boat making and repair relative to their cost. This is an indication that the boat building and repairs sector of the Akwa Ibom blue Economy is viable and that investing in it is will not be unprofitable as customers are willing to pay more for its services. The demand curve in Figure 6 is flat which represent the price, meaning that as the cost of boat making decreases, more people will be willing to purchase and repair more boats. The area under the curve OBCD is the total variable cost, representing the sum of all expenses that change directly with the number of boats purchased or repaired.
It was concluded that the boat building industry is viable, even when it is not being given special consideration despite it being one of the most integrated processing and assembly industry as opined by Davids. The boat building and repairs industry in the study is weak, localized and its sources of material are not environmentally friendly and needs to be attended to. Therefore, to project the nation’s boat building industry among the key players in the international community, more needs to be done by stakeholders if the actualisation of the blue economy development is to be achieved.
[Crossref] [Google Scholar] [PubMed]
Select your language of interest to view the total content in your interested language